Ice cover on the Great lakes typically reaches maximum in the second week of March and the median since 1980 is at about 40%.
This week ice cover reached over 90%. Maximum in a “normal” year would be reached in the second week of March.
Both the diagrams below are from the Canadian Ice Service with the first showing ice cover historically for this week (since 1980) and the second showing the ice cover for this season (2013/2014) with the median for 1980-2010. This season ice cover is running at more than twice the median values.
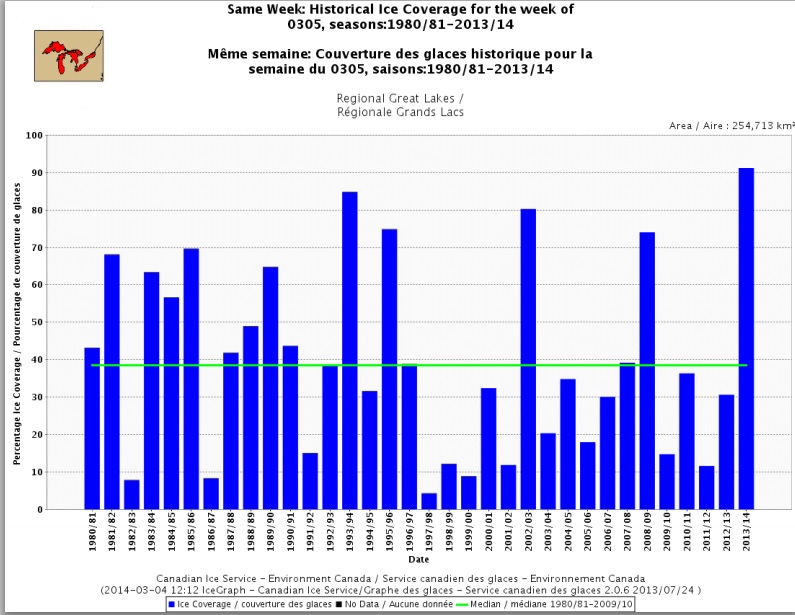
Historical Great lakes Ice Cover week of 0304
Canadian Ice Service

Great Lakes Ice Cover Season 2013 – 2014 Canadian Ice Service
Global warming contortionists will no doubt find strange and convoluted explanations to show that this massive increase of ice cover is not inconsistent with global warming. The missing heat could be hiding in the deep waters around the world and Nessie is probably running a fever.
Of course this massive increase of ice cover is also not inconsistent with the start of another Little Ice Age.
The most parsimonious explanation is that the climate and weather are going through their “natural variations” (due directly or indirectly to the Sun) and that there is no missing heat. Which leads to the obvious – but politically incorrect – conclusion that man-made global warming is – at most – insignificant.
Tags: global warming, Great Lakes, Ice cover, missing heat
