Archive for the ‘Alarmism’ Category

Climate can only be observed as weather

November 19, 2014

One weather event is not climate but climate can only be observed – ultimately – as weather. Climate is an integration of local weather over space and time. Supposed climate change which does not show up as changes to local weather to give conditions which lie outside the range of normal variability of that local weather, is no change.

Anthropogenic global warming when it is a conclusion which can only be based on “adjusting” raw data or is only that predicted by a model, but which cannot be actually observed, is of little relevance and of no importance. It is certainly a rather stupid basis for policy.

There has been no global warming of any kind (anthropogenic or otherwise) – even with adjusted data – for over 18 years. The anthropogenic component – supposed to be due to on man-made emissions of carbon dioxide – is not discernible, even though carbon dioxide emissions from fossil fuel combustion have increased by some 70% in that time.

The politically correct “policy” of reducing fossil fuel combustion would seem to be of no significance and of little relevance. This particular weather event in North America only adds to the body of evidence that is not consistent with global warming.

Reuters: All 50 U.S. states feeling freezing temperatures

Temperatures in all 50 U.S. states dipped to freezing or below on Tuesday as an unseasonably cold blast of weather moved across the country, while heavy snow prompted a state of emergency in western New York.

In the U.S. South, states were bracing for a record chill from the Arctic-born cold that swept the Rocky Mountains last week.

Every U.S. state, including Hawaii, was bitten by temperatures at the freezing point of 32 degrees F (0 C) or below, the National Weather Service (NWS) said.

Signs of global cooling accumulate while IPCC denies evidence and relies on models

November 2, 2014

Rational argument cannot penetrate faith.

Ask for evidence and you get model results. Ask for proof that the models are valid and you get hindcasts based on adjusted data. Ask for evidence of man-made emissions causing global warming and the answer is that it must be so for there is no other explanation. There isn’t if you don’t want to see it.

The IPCC believes that model results – even where the models are wrong – provide “conclusive” evidence of not just man-made global warming but that it is due to the emissions of carbon dioxide. It is politics not science. And the politics from India and China have ensured that the IPCC accepts fossil fuels till 2100!!!

For there is – in fact – no actual evidence in the form of data or measurements. There are only model results. There are only model forecasts where the track record shows that every IPCC forecast has been wrong. Fossil fuels – especially gas – will be around and will continue for many hundreds of years unless cheap fusion comes earlier.

Instead of real data showing support for the models, the evidence is accumulating that not only are the models wrong, but also that there are more indications that a global cooling is underway rather than global warming. Real measurements and real data show:

  1. that global temperatures have been stagnant for 18 years while carbon dioxide emissions have increased by 70% and carbon dioxide concentration has increased just under 15%,
  2. that therefore carbon dioxide concentration in the atmosphere has had no significant effect on global temperature,
  3. that the emissions and absorption of carbon dioxide from “natural” causes has an uncertainty of around 10%
  4. that man made carbon dioxide emissions make up less than 5% of all carbon dioxide emissions and their contribution to carbon dioxide concentration is of the order of 40% (assuming that there is no lag between accumulation of carbon dioxide in the atmosphere and absorption mechanisms from the atmosphere),
  5. that global temperatures actually show a small downward trend over the last 10 years,
  6. that global temperatures of the past have been corrupted by being adjusted or otherwise homogenised with the intent (conscious or unconscious) to cool the past,
  7. that man-made carbon dioxide emissions have been overestimated and in reality are much lower as a proportion of natural emission sources,
  8. that natural carbon dioxide absorption processes are larger than assumed,
  9. that Antarctic ice cover is at the highest levels ever recorded,
  10. that Arctic ice cover has returned to be within 1 SD of the long term 1980-2010 average,
  11. that the rate of sea-level rise is still at the same rate as the long-term recovery from the last glacial,
  12. that snow cover in the northern hemisphere is increasing
  13. that ice cover on the Great Lakes is increasing,
  14. that there is more forest cover now than when the alarmism began, and
  15. that polar bear numbers are healthy and increasing,

Add to this that a VEI5+ volcano eruption has not occurred since 1991 and is long overdue. It will most likely show up along the Pacific Ring of Fire or in Indonesia. Consider also that the Bárðarbunga  volcano in Iceland has been producing sulphur dioxide at a rate which in 9 weeks has pumped twice as much SO2 into the atmosphere than all of Europe does in a year. Bárðarbunga  volcano is far from VEI5+ levels and the eruption could continue for months. The SO2 emissions are not all reaching the stratosphere but will surely lead to increased cloud formation around sulphur aerosols and cloud levels will probably be high through at least next year. It becomes increasingly clear that further cooling effects are already in the “natural” pipeline of events. Some new glacier formation has been observed in the Scottish highlands. Some Alpine and Himalayan glaciers have started to increase and while others still decrease, the observation of increase where there has been none before is highly significant. The Great lakes have seen unprecedentedly high ice cover levels. Snow cover in the northern hemisphere is high and is lasting longer into spring than for some time.

But the models and the presuppositions and the misconceptions of the religious high priests cannot be easily denied by the faithful and have an inertia of their own. The IPCC  remains delusional and in denial about reality. It continues to play its global warming fiddle but it is badly out of tune and its alarmist cacophony is being overtaken by real events.

It may not be a glacial age that is starting but another Little Ice Age looks like it is on its way.

Reanalysis reveals no significant global warming in New Zealand in the 20th century

October 31, 2014

New Zealand has one of the longest temperature-time series available.  In the past it has been reported that this data-set  confirms the view of global warming of just under 1ºC per century. But that is now highly suspect. A new paper reanalysing the data has been published and shows that the trend is less than one-third of what has been previously assumed.

de Freitas, C.R., Dedekind, M.O. and Brill, B.E. 2014. A reanalysis of long-term surface air temperature trends in New Zealand. Environmental Modeling and Assessment, do1 10.1007/s10666-014-9429-z.

AbstractDetecting trends in climate is important in assessments of global change based on regional long-term data. Equally important is the reliability of the results that are widely used as a major input for a large number of societal design and planning purposes. New Zealand provides a rare long temperature time series in the Southern Hemisphere, and it is one of the longest continuous climate series available in the Southern Hemisphere Pacific. It is therefore important that this temperature dataset meets the highest quality control standards. New Zealand’s national record for the period 1909 to 2009 is analysed and the data homogenized. Current New Zealand century-long climatology based on 1981 methods produces a trend of 0.91 °C per century. Our analysis, which uses updated measurement techniques and corrects for shelter-contaminated data, produces a trend of 0.28 °C per century.

Dr. Craig Idso writes:

De Freitas et al. report that, whereas the previous analysis yielded a trend of 0.91 ± 0.30°C per century, their analysis – which used updated measurement techniques and corrects for shelter-contaminated data – produces a trend of only 0.28 ± 0.29°C per century, which is a heck of a lot less than what had previously been believed to have been the case.

The significance of de Freitas et al.’s work is two-fold. First, the authors report that the old, contaminated data with the inflated warming trend has been “widely used as inputs for societal design and planning purposes” all across New Zealand. Second, de Freitas et al. note these data are “extensively used in hindcast verifications for regional and local models.” However, as the saying goes, “garbage in equals garbage out.” Therefore, at best, the corrected New Zealand temperature trend, which is three times smaller than the uncorrected version, calls into question all results, findings, conclusions, and policies built upon or derived from the old contaminated data record. And at worst, it invalidates them.

Given the great importance of starting with the proper baseline, one would hope that with so much at stake in terms of economics, personal freedoms, and governance, much greater care and scrutiny would be applied to ensuring the quality and reliability of near-surface air temperature records. But obviously, such has not been the case for New Zealand. And it begs the question as to where else temperature records might be less than par.

To obtain a “global temperature”, raw temperature data from available sites is massaged, applied to geographical grids, corrected, adjusted, “filled-in” and otherwise homogenised. But the algorithms used to make these adjustments inevitably carry the preconceptions and misconceptions of the adjusters. As raw data is reviewed it is becoming increasingly obvious (in the US, in Australia in Germany and now in New Zealand) that “adjustments” that have been made over the last 20 years have been plagued by “confirmation bias”. Rather than a clear-cut warming record what is apparent is that many data-sets have been adjusted to “cool the past”.

Did one false report in Swedish newspaper cause the submarine fiasco?

October 28, 2014

I have posted earlier about the “Russian submarine in the Stockholm archipelago” hysteria which gripped the Swedish media and – apparently – the Swedish military for 6 days. (Though my perception is that the hysteria was with the media and the military and not with the general public. It did not cause much general alarm but it did provide another subject for after-dinner conversation and for wild speculation in the bars).The hunt is now over and there is plenty of egg on many faces. The Russian press and social media are having a field day with Swedish military alarmism.

But all of it may have originated from just one false article in the right-leaning Svenska Dagbladet. Of course it was compounded by further false sightings. This is a report from the left-leaning Dagens Nyheter (the nearest media competitor to the Svenska Dagbladet).

Dagens Nyheter: The operation carried out by the Swedish armed forces in the Stockholm archipelago was not triggered by one emergency call in Russian. So says Naval Intelligence to DN.

On Saturday, October 18th the Swedish newspaper Svenska Dagbladet revealed that an emergency call in Russian set off the alarm and started the hunt for a damaged Russian submarine in the Stockholm archipelago. The newspaper also said that there had been encrypted radio traffic between a transmitter in the archipelago and one transmitter located in Kaliningrad where large parts of the Russian Baltic Fleet is located. This news was reproduced by virtually all Swedish media, including DN. The disclosure also received international attention.

Already in last Friday’s paper newspaper DN revealed that no radio communications between the field of operation and Kaliningrad were intercepted during the six-day operation.

DN has now with the support of Freedom of Information rules obtained a copy of the transcript from the Armed Forces and has had the transcript translated.
Documents relating to military operations are usually completely or partly exempt under secrecy rules. When documents are denied the authorities are required to disclose an “Incident Report”.  Those denied documents can then appeal the decision. But no Russian emergency traffic ever occurred according to the military’s own investigation reported DN’s intelligence source. The documents just do not exist, according to the military.

“I thought it was exciting to read about the Russian emergency call you reported. But there is no such thing – the information is incorrect” says a source in Navy intelligence.

Has there been any radio traffic from Stockholm archipelago to and from Kaliningrad?

“There is traffic from Kaliningrad constantly, 24 hours a day. This is nothing strange. It’s just like any of our radio stations everywhere in Sweden – they transmit all the time” says DN’s source.

And if all the fuss was triggered by just one false report in the Svenska Dagbladet, it begs the question as to whether it was just bad journalism or whether there was another motive and a hidden agenda? And why did the Swedish military react so hysterically to just one bad media report?

Shale gas in Europe worries Putin

October 25, 2014

It might seem counter-intuitive for Russia to be against the advent and development of shale gas in Europe since they themselves have huge quantities of oil and gas bearing shale in SiberiaBut Russia has a very large investment in conventional natural gas production and pipelines (through Gazprom) which must be protected and nurtured. Putin needs to ensure revenues and that exports of conventional natural gas gives them a reasonable return on the investment before moving onto shale gas. About 30% of Europe’s gas comes from Russia. Russia needs Europe to go slow with its own shale gas production and to continue buying Russian gas at reasonably high prices for as long as possible. So much so that Russia has even been supporting anti-fracking groups in Europe. (It is a little ironic when the European anti-fracking alarmists take well disguised Russian funds and play into Russian hands).

The MotleyFoolNow there are accusations that Russia is working hard to keep Europe dependent on its gas supplies. According to Nato chief Anders Fogh Rasmussen, Russia is doing this by funding anti-fracking groups. That’s something that some of the larger groups deny, but it would be hard to suss out where all of their donations come from in the anti-fracking movement.

There are good reasons for Russia to undertake such a covert operation. For starters, Gazprom would suffer greatly if its European business started to slip away. Second, by keeping Europe hooked on Gazprom gas, Russia maintains a strong bargaining position in world politics.

That, however, just gives the United States more reason to come to the aid of its European allies. Right now, the export of U.S. natural gas is severely limited. With the combination of horizontal drilling and hydraulic fracturing (fracking) in the U.S., however, the flow of gas has outstripped demand and pushed U.S. domestic gas prices to record low levels.

While being able to sell natural gas to Europe would be a huge win for Europe politically and U.S. gas drillers financially, it would also be a big win for pipeline operators like Kinder Morgan (NYSE: KMI  ) . Moving natural gas from where it’s drilled to where it’s used made up roughly 50% of Kinder Morgan’s business last year. The business isn’t about natural gas prices, either; it’s about providing a service. CEO Richard Kinder describes it this way: “We operate like a giant toll road.” So, if natural gas starts going overseas, Kinder Morgan will be involved in the process and make money doing it.

The possibility of surplus shale gas from the US entering Europe and depressing sales of Russian natural gas is a nightmare economic scenario for Vladimir Putin. Even the recent drop in oil prices has seriously unbalanced the Russian budget which needs an oil price of over $100 to be in balance.

Putin takes part in final session of 11th Valdai International Discussion Club meeting

Putin at the 11th Valdai International Discussion Club meeting in Sochi

Putin is clearly worried. Russian President Vladimir Putin took part at the plenary session of the Valdai International Discussion Club in Sochi. He talked up the risks with US shale gas to Europe and talking up the benefits of Russian gas.

TassPutin: Europe’s transition to American shale gas will be suicidal for EU economies

Russian President Vladimir Putin believes that transition to shale gas will be suicidal for the EU economies. In his speech at the Valdai discussion club on Friday, Putin said that Russia’s trade turnover with the European Union stood at 260 billion dollars in the first half of 2014 even despite sanctions. He assumed, however, that the trade volumes could fall if Russia stopped all gas and oil supplies to Europe.

“We assume that it can happen at the will of our partners in Europe. But it’s hard to imagine,” Putin said, explaining that alternatives to Russian gas and oil supplies were worse.

It is either the crisis-hit Middle East where the “Islamic State” militants have stepped their operations or deliveries of shale gas and shale oil from the United States.

“We can imagine that /deliveries/ of shale oil and shale gas from the United States are possible. But how much it will cost?” Putin asked.

“This is going to be a direct way to reducing their own competitive ability because it is going to be more expensive than our pipe gas or oil delivered from deposits in Russia,” the Russian president went on to say.

“They are simply going to kill their competitive ability. What kind of a colony Europe should be to agree to this option. But I believe that common sense will prevail. The same is true of Asia,” Putin said in conclusion.

For very many reasons the very best thing that Europe (and Asia) could do would be to expedite the production of their own shale gas. It would bring down energy prices, stimulate growth, increase jobs, increase independence from Russia, increase exports, increase competitiveness against the US and consolidate energy intensive industries which are moving out. But this would have to overcome the opposition of the alarmist, European green parties who have a remarkable facility for being counter-productive.

Opposing the development of shale gas in Europe gives Russia the edge on the geopolitical playing field.

US shale oil boom visible from space

October 21, 2014

The drop in oil prices continues though somewhat slowed down by Chinese import demand:

WSJU.S. and global crude benchmarks ended lower Monday amid choppy trading and concerns that member nations of the Organization of the Petroleum Exporting Countries will maintain high production levels in a bid to compete for market share despite growing global crude supplies.

The current drop in oil prices is put down to a glut on the market caused by the boom in shale oil production in the US and the slow-down in the global economy.

The boom in shale oil production is even visible from space.

Satellite Images Reveal How the U.S. Oil Boom Is Creating New Cities

bakken shale field shows up from space Image NASA/io9

io9This image from NASA reveals a massive cluster of lights in what was — until recently — desolate prairie. This is the Bakken Shale, an oil-rich rock formation stretching across parts of North Dakota, Montana and Canada. The lights are from the illuminated derricks, local boomtowns and gas flares of the oil fields.

Misguided alarmists who have demonised fossil fuels don’t like this. But I find the picture and the visibility of the shale production greatly encouraging. Carbon dioxide has no significant deleterious impact on climate and the availability of fossil energy is what will ensure continued human development.

The Bakken Shale field is a vast resource across Montana, North Dakota, Sasketchewan and Manitoba and a significant contributor to the game changing advent of shale oil and shale gas.

The Bakken Shale ranks as one of the largest oil developments in the U.S. in the past 40 years. The play has single-handedly driven North Dakota’s oil production to levels four times higher than previous peaks in the 1980s. As of 2012, ND is second to Texas in terms of oil production and boasts the lowest unemployment rate in the country at ~3%.

The Bakken Shale Play is located in Eastern Montana and Western North Dakota, as well as parts of Saskatchewan and Manitoba in the Williston Basin. Oil was initially discovered in the Bakken play in 1951, but was not commercial on a large scale until the past ten years.

… The Bakken is estimated to hold as much as 400 billion barrels of oil equivalent in place.

US shale fields map EIA


IFRC: In 2013, deaths by natural disasters were 80% down from average

October 19, 2014

The “climate change” brigade would have us believe that every storm, every hurricane, every incidence of heavy rain and every blizzard is an unprecedented event and due to man-made global warming (which in turn, they would have us believe, is primarily due to the combustion of fossil fuels).

But they are denied by the numbers.

The International Federation of the Red Cross and Red Crescent Societies has published its “World Disasters Report 2014”. They compile data for both natural and technological disasters. Last year (2013) saw deaths by natural disaster at very low levels (22,452) and about 20% of the decadal average (97,954). Regarding natural disasters they say:

According to the Centre for Research on the Epidemiology of Disasters (CRED), 337 disasters related to natural hazards and 192 related to technological hazards (typified hereafter as “natural disasters” and “technological disasters”) were reported worldwide in 2013. The number of natural disasters was the lowest of the decade. As regards technological disasters, their number was the second lowest of the decade, almost half the number in 2005, the peak year of the decade.

Floods remain the most frequent natural disasters. Storms were the second most frequent, but the number of events in 2013 was slightly higher than the decade’s average.

The number of deaths caused by natural disasters (22,452) is almost 80 per cent below the average for the decade (97,954), much lower than the peak years of 2004 (242,829 deaths), 2008 (235,272 deaths) and 2010 (297,728 deaths).

IFRC Deaths by natural disaster

IFRC Deaths by natural disaster

Monetary losses are dominated by the effects of earthquakes and tsunamis – when they occur. Windstorm deaths are also sporadic. Floods are more regular.

IFRC Monetary Losss by disaster type

IFRC Monetary Losss by disaster type

Evidence for man-made global warming has vanished

October 14, 2014

Where is the real evidence of man-made global warming? Where are the signs? Where are the measurements?

The simple fact is that in spite of what computer models might say, without global warming, there is no man-made global warming.

I am more persuaded by evidence than by climate models which have only demonstrated that they do not work. The man-made global warming hypothesis has a number of crucial assumptions which are all proving to be unproven, lacking evidence or just plain wrong.

  1. Global temperature is increasing, and
  2. Increasing carbon dioxide concentration in the atmosphere is due to man-made effects, and
  3. Increasing CO2 concentration does give measurably increasing global temperature, and
  4. Increasing man-made carbon dioxide emissions does give significant and measurable increases in global temperature.

Every one of these assumptions is suspect and- at best – uncertain.

“Global Warming” has warped to be “Climate Change” so that any slightly unusual weather event can be claimed to be man-made. The hypotheses are never falsifiable. But the bottom line remains that all the change can be put down to man-made emissions which increase the heat trapped on earth, which then cause global temperatures to rise and fuel the “climate changes” observed. But all man-made climate change vanishes without man-made global warming to power it.

The signs of global warming were touted as being ice melting, sea level rising, loss of polar wildlife and sundry other secondary catastrophes. The poster-children of the global warming religion were the loss of polar ice, the corresponding rise of sea levels, disappearing islands, and the extinction of polar bears.

Just consider the real evidence.

Antarctic sea ice cover has reached the highest levels ever measured and has reached record levels for each of the last 3 years

NSIDC: This year’s Antarctic sea ice maximum was 1.54 million square kilometers (595,000 square miles) above the 1981 to 2010 average maximum extent, which is nearly four standard deviations above this average. The 2014 ice extent record is 560,000 square kilometers (216,000 square miles) above the previous record ice extent set on October 1, 2013. Each of the last three years (2012, 2013, and 2014) has set new record highs for extent in the Antarctic.

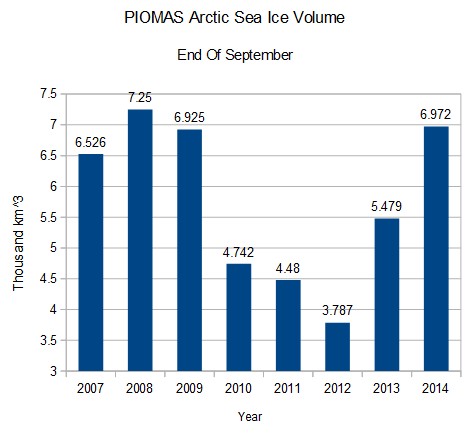
Arctic sea ice cover has recovered from the low of 2012 and is now within the 2SD band of the 1981-2010 average. It is up 84% from 2012 and the trend is upwards.

ScreenHunter_3480 Oct. 09 15.16

The trend for Arctic ice is upwards

Global sea ice cover is unchanged and shows no discernible trend since 1979.

Global temperatures have not risen for 18 years. In recent years there may even be a cooling trend.

Forbes:Remote Sensing Systems(RSS) also compiles data from the satellite instruments, though RSS measures a slightly different range of the lower atmosphere. RSS reports a similar temperature history,available here. In the RSS compilation, we see not just a recent temperature plateau, but actual cooling. Again, the pace of warming throughout the entirety of the record is approximately 1 degree Celsius per century.

In the last 18 years man made carbon emissions have increased by about 70%. Over the same period carbon dioxide concentration in the atmosphere has risen by about 10% and global temperatures have not risen at all. On this data there is no correlation between global temperature and carbon dioxide concentration let alone carbon dioxide emissions.

Polar bear numbers are higher than for 50 years and walrus numbers are very high as well.

Sea level increases are no higher than the long term rise due to coming out of a glacial age. A rise of 2 inches by 2050 is on the cards.

Where is the evidence of man-made global warming?


In defence of the Quagga mussel

October 13, 2014

Quagga Mussel from Lake Michigan – image lakescientist.com

Here we go again! Yet another successful species is being demonised and attacked and oppressed just because it is successful.

A species of freshwater mussel – the Quagga Mussel – is being targeted by so-called conservationists in Europe and the US as an “invasive” or “alien” species. Just because it is successful. Just because it has made the hazardous journey from its origins across hostile environments inhabited by unfriendly humans to establish itself in fresh-water bodies in the Great Lakes and now across Europe and the UK.

It originates in the drainage of the River Dnieper in Ukraine into the Black Sea. It lives only in freshwater and can tolerate brackish water but is killed by the salt in the sea water. It is edible for humans but overeating can lead to the concentration of some toxins. But somehow it has managed to get across the Atlantic to the Great Lakes and to many canals and rivers in Europe. Now it has been found in the UK. Fresh water species from the ponto-Caspian region (from the Black, Caspian, and Azov seas) have been observed to be spreading westwards for many years.

R Dnieper – map KidsBrittanica

A new paper has chosen a suitably alarmist title to get massive coverage today from the UK newspapers and radio.

Gallardo and Aldridge, Is Great Britain heading for a Ponto–Caspian invasional meltdown?, Journal of Applied Ecology  10/2014; DOI: 10.1111/1365-2664.12348

The choice of alarmist vocabulary is itself off-putting. It suggests that the research is so unsound that it needs to be propped up by the language of the scandal-sheets!

“Alien”, “invasive”, “meltdown”, “catastrophic” are some of the words chosen. And not just mussels. They are accompanied by predatory, omnivorous, “killer shrimps”.

The GuardianAlien Quagga mussel may already have been joined by other invasive species

Scientists warn that the destructive mussel recently spotted in the UK, has probably been joined by additional undetected invaders, such as shrimp, that pose a threat to native wildlife.

A foreign mussel recently found for the first time in the UK is likely to have already been joined undetected by at least four other alien species that threaten native shrimp and fish, scientists warn on Monday.

The Quagga mussel (Dreissena rostriformis bugensis), which was found in the river Wraysbury on 1 October and can cover boat hulls and smother native mussels to death, is just one of a group of freshwater species that has been spreading westward from the Ponto-Caspian region in south-east Europe in recent years and which risk causing a “meltdown” as they invade Britain.

The south-east of England is most at risk from these invaders which can prey on native British freshwater species, substantially alter the ecology of waterways and wreak economic damage by blocking water pipes, according to a new study by a University of Cambridge team. …..

.. The study warns that the first wave of invaders, including the Quagga, are likely to act as a beachhead for further invaders from the Ponto-Caspian region, aiding their establishment. “Because there are so many of these organisms that have had a long evolutionary time to develop a cosy relationship with each other, what we’re finding is when they get over here they tend to facilitate each other,” said Aldridge.

Quagga mussels reached the Great Lakes some time ago

LakeScientist:

An increase in water clarity in Lake Michigan is actually cause for concern. The heightened clarity is due to quagga mussels, an invasive species. Gary Fahnsteil, a senior ecologist at the National Oceanic and Atmospheric Administration Great Lakes field station in Muskegon, Mich., was a part of a group of scientists who measured Lake Michigan’s water quality.

Clear water is usually a welcome phenomenon; however, the 950 trillion quagga mussels are making Lake Michigan too clear to support aquatic life, especially for salmon and the other fish they consume. Fahnsteil and others consider quagga mussels to be the most detrimental of the 186 invasive species that occupy the Great Lakes. The mussels’ eating behavior wreaks havoc on the aquatic food chain at every level. In 2000, Great Lakes researchers discovered a phenomenon they called the doughnut in the desert,” a massive, ring-shaped bloom of aquatic plants that helps sustain aquatic animals that stay in the lakes during the winter. The bloom appears in March and April.

However, they also discovered that quagga mussels have taken a big bite out of the “doughnut.” As a result, the animals that rely on it face starvation in the winter. Furthermore, the fish that feed off of those species could starve as well.

Well with the entire scientific and alarmist bastions against them it doesn’t look good for the Quagga mussel. They are now one of the oppressed species. But I am rooting for them. Having traveled from Ukraine across oceans of hostile salt water, they deserve to enjoy all their successes.


Effects of influensa medicines exaggerated by sponsored research

October 8, 2014

I have posted earlier about how flu vaccines tend to be over-hyped and over-promoted. A new study confirms that research sponsored by pharmaceutical companies were much more positive than those by independent researchers.

The manufacture and sale of flu vaccines is enormously lucrative. Just in the UK the program costs £120 million every year. Worldwide just influensa vaccine sales are an estimated $4 – 5 billion. The total vaccines market is expected to grow from about $30 billion in 2012 to about $40 billion in 2015! For adult vaccines the biggest growth comes from public health programs pushing influensa vaccines:

Moreover in public health programs

The names of the members of the committees which recommend wholesale flu vaccinations are often shrouded in secrecy and often  – when revealed – are found to have unhealthy ties to the manufacturers of the vaccines.

Swedish Radio reports:

In the world of research meta-analyses, reviews of research studies available, act as a quality assurance. But when Australian researchers reviewed 26 meta-analyses of so-called neuraminidase inhibitors it was apparent that researchers sponsored by pharmaceutical companies had made more positive conclusions than their independent counterparts.

The study is published in Annals of Internal Medicine, writes The Guardian.

But the phenomenon is not new in the scientific community.

“There are lots of examples of how corrupt the system has been” said Björn Beermann, former professor at the MPA.

Last spring, it was revealed through the research network Cochrane that Tamiflu in principle was ineffective and that the pharmaceutical company Roche had regularly concealed “negative” research findings. It caused a debate about Sweden’s decision to buy into a giant stock of Tamiflu for a quarter of a billion kronor. Globally the bill amounted to nearly seven billion kronor ($1 billion).

In recent years it has become more difficult to conceal studies with undesirable results. Now, all the studies that seek publication have to be notified in advance of the study being conducted.