It’s 0800 on 30th January 2021.
It’s 0800 on 30th January 2021.
This paper in Nature would not have have had any chance of being published a few years ago. But times are changing.
CNRS: “The possibility of major climate change in the Atlantic region has long been recognized and has even been the subject of a Hollywood movie: The Day After Tomorrow. To evaluate the risk of such climate change, researchers from the Environnements et Paléoenvironnements Océaniques et Continentaux laboratory (CNRS/University of Bordeaux) and the University of Southampton developed a new algorithm to analyze the 40 climate models considered by the latest report from the Intergovernmental Panel on Climate Change (IPCC). Their findings raise the probability of rapid North Atlantic cooling during this century to nearly 50%. Nature Communications publishes their work on February 15, 2017”.
My own view is that man-made global warming is insignificant and virtually impossible to measure. The apparent climate turbulence we may currently be experiencing is probably the exhibition of instabilities as climate shifts from an interglacial paradigm to the, more normal, glacial conditions. The transition will probably be “rapid” in geologic terms which probably means a thousand years or so. Major volcanic eruptions (VEI>6) are overdue. This interglacial has lasted some 13,000 years and is also, relatively, long. I think it feasible that 2 or 3 major volcanic eruptions in relatively quick succession could provide the conditions to trigger a full transition. Once glacial conditions are established they will last for about 100,000 years. And we will then be very thankful for all the fossil or nuclear energy we can have available to us.
Giovanni Sgubin, Didier Swingedouw, Sybren Drijfhout, Yannick Mary, Amine Bennabi. Abrupt cooling over the North Atlantic in modern climate models. Nature Communications, 2017; 8 DOI: 10.1038/ncomms14375
Abstract: Observations over the 20th century evidence no long-term warming in the subpolar North Atlantic (SPG). This region even experienced a rapid cooling around 1970, raising a debate over its potential reoccurrence. Here we assess the risk of future abrupt SPG cooling in 40 climate models from the fifth Coupled Model Intercomparison Project (CMIP5). Contrary to the long-term SPG warming trend evidenced by most of the models, 17.5% of the models (7/40) project a rapid SPG cooling, consistent with a collapse of the local deep-ocean convection. Uncertainty in projections is associated with the models’ varying capability in simulating the present-day SPG stratification, whose realistic reproduction appears a necessary condition for the onset of a convection collapse. This event occurs in 45.5% of the 11 models best able to simulate the observed SPG stratification. Thus, due to systematic model biases, the CMIP5 ensemble as a whole underestimates the chance of future abrupt SPG cooling, entailing crucial implications for observation and adaptation policy.
Even The Guardian (a high priest of the man-made global warming religious fantasy) is compelled to report!!

CNRS Press Release:
Current climate models all foresee a slowing of the meridional overturning circulation (MOC)2—the phenomenon behind the familiar Gulf Stream, which carries warmth from Florida to European shores—that could lead to a dramatic, unprecedented disruption of the climate system. In 2013, drawing on 40 climate change projections, the IPCC judged that this slowdown would occur gradually over a long period of time. The panel’s findings suggested that fast cooling of the North Atlantic during this century was unlikely.
Oceanographers from the EU EMBRACE project team reexamined the 40 projections by focusing on a critical spot in the northwest North Atlantic: the Labrador Sea. The Labrador Sea is host to a convection system ultimately feeding into the ocean-wide MOC. The temperatures of its surface waters plummet in the winter, increasing their density and causing them to sink. This displaces deep waters, which bring their heat with them as they rise to the surface, preventing the formation of ice caps. To investigate this phenomenon in greater detail, the researchers developed an algorithm able to detect quick sea surface temperature variations. Their number crunching revealed that 7 of the 40 climate models they were studying predicted total shutdown of convection, leading to abrupt cooling of the Labrador Sea: by 2–3 °C over less than 10 years. This in turn would drastically lower North Atlantic coastal temperatures.
But is such rapid cooling a real possibility? (After all, only a handful of the models supported this projection.) To answer this question, the researchers honed in on the critical parameter triggering winter convection: ocean stratification. Indeed, 11 of the 40 models incorporated vertical variation in the density of oceanic water masses. And of these 11 models, which we may furthermore consider to be the most reliable, 5 (i.e., 45% of the models) predicted a rapid drop in North Atlantic temperatures.
When (not if) the next little ice age or even the end of this interglacial begins, we will first observe it by cooler summers – not initially by colder winters. While the “climate scientists” are chasing non-existent links between man-made carbon dioxide emissions and “global temperature”, they are reduced to data tampering and cooling the past. There is not a shred of evidence but only much conjecture that man-made emissions are of any significance.
They cannot predict the future so they are rewriting history. Every year the temperatures of the past are adjusted downwards. No model forecast of global temperature has come anywhere near predicting actual development. When the models don’t fit, it is time to dump the models. “Climate science” is now two decades out of date. Today Obama will announce another round of restrictions on the climate bogey-man – anthropogenic carbon dioxide emissions – even though his plans will have no impact on climate and will only make life more expensive.
The primary “forcing” or feed-back loop which will set off the little ice age or glacial conditions will be a reduction of ice melt over a few summers and followed by an increase of ice accumulation, which in turn will increase the solar energy reflected directly back into space. That will further reduce the ice melt in subsequent years. Cold winters and an increase of rate of ice growth is not required to set this off. Current, “normal” rates of ice growth in the winter are quite sufficient to reproduce the little ice age or even the return to glacial conditions provided that the summer melt is reduced and reducing. A large volcanic eruption with much dust ejected could well be the key factor to enhance the “forcing”. A year or two or three without summers in the higher latitudes could well be the key. It is probably of more significance in the northern hemisphere with its larger land mass which would support the direct growth of surface ice. In the southern hemisphere there is no reason that Australia could not also be covered with glacial ice sheets but more sea-ice would have to be created first. That would require much colder winters and not just cooler summers to trigger the change. It is not the climate near the equator or the tropics which controls. It is the regions above 50N and below 50S where we will first see the indications. It is the combination of reduced ice-melt followed by increased ice accumulation which will be critical.
Here in Sweden it has been a miserable July. The Finnish summer has been the coldest on record – so far. It has been the coldest July in most of Australia in twenty years. Iceland has seen snow in summer which is not that common. Scotland is said to have seen its worst summer in 40 years. Montana, Wyoming and Idaho have seen anomalous summer snow. The Greenland ice melt started very late and seems to already have come to an end. “Freak” snow storms have come to the Rockies in July. Over 40 people and 250,000 alpacas died in Peru in a cold wave and Chile declared cold emergencies..
“Global temperature” is not a real thing. It is an artefact, a number calculated by massaging and adjusting real data. No matter what the self-styled “climate scientists” believe and worship, “climate change” which is not manifested as changes to local weather and which can actually be experienced probably does not exit. We are now in for 2 – 3 decades of cooling which will include a little ice age. But over the next 1,000 years we will also be back into glacial conditions.
Right now, I experience more indicators of cooling than of any warming.
And when the cooling does start – as it will – we shall be very thankful for the more than 1,000 years of fossil fuel reserves we have.
Carbon dioxide concentration in the atmosphere is the highest in modern times and has been increasing for well over a decade. But global temperatures – however that is defined – has shown no sign of warming and a slight decrease in that period. The Sun’s activity is down and reducing to levels similar to that of the Maunder Minimum in this Landscheidt Minimum. A new Little Ice Age is likely by 2030.
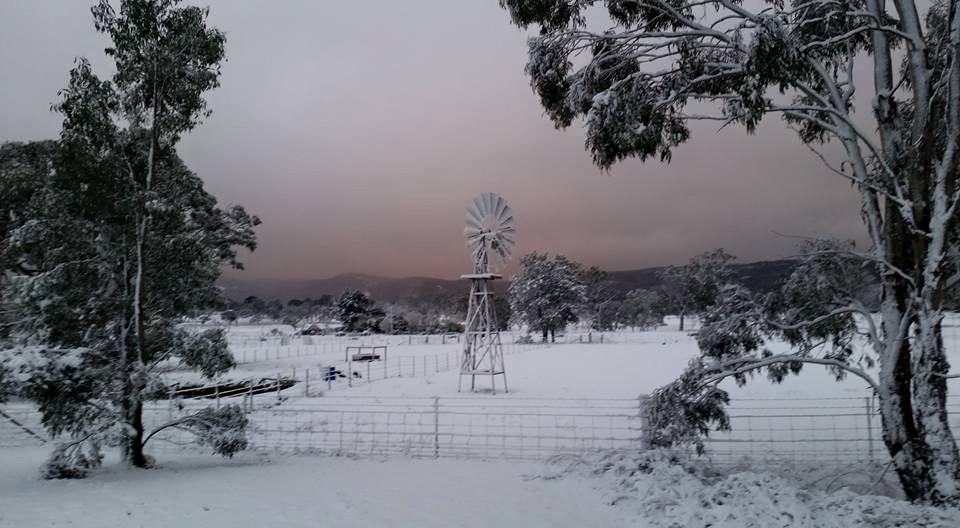
The small little signs of weather that are harbingers of the coming Little Ice Age are accumulating – even in the southern hemisphere. Australia is experiencing a “cold” wave (though +12ºC does not seem particularly cold). The cold wave is also giving “unprecedented” (for a decade) levels of snow.
It is inevitable that since the global warming priesthood have been preparing for the icecaps melting that we will now enter a new ice age.
Maybe this time the glaciers are going to spread in the southern hemisphere across Australia and South America?
SMH: Snow creates winter wonderland … in Queensland, as well as NSW
It is not completely certain but it does look like Solar Cycle 24 has just passed its maximum. The maximum was initially expected to be reached in late 2012 and gradually drifted to late 2013. Now it would seem that this may not have occurred till late 2014. While the minima at the beginnings of SC 23 and 24 seem to have been c. 12 years apart, the maxima are closer to 14 years apart.

SC24 2015 January From NASA Hathaway
The length of Solar Cycles is thought to be linked to the solar activity to be expected in the following 2 cycles. Periods much longer than the average of 11.2 years seem to lead to decreased subsequent activity, lower sunspot numbers and also lower global temperatures.
Solheim et al predicted lower sunspot activity and cooler times during SC 24. Now it would seem this will also be the prevailing paradigm through SC25 and perhaps even SC26. Another two decades of reduced sunspot activity and a global cooling carried by the ocean cycles would seem to be on the cards.
Relations between the length of a sunspot cycle and the average temperature in the same and the next cycle are calculated for a number of meteorological stations in Norway and in the North Atlantic region. No significant trend is found between the length of a cycle and the average temperature in the same cycle, but a significant negative trend is found between the length of a cycle and the temperature in the next cycle. This provides a tool to predict an average temperature decrease of at least 1.0ºC from solar cycle 23 to solar cycle 24 for the stations and areas analyzed. We find for the Norwegian local stations investigated that 25–56% of the temperature increase the last 150 years may be attributed to the Sun. For 3 North Atlantic stations we get 63–72% solar contribution. This points to the Atlantic currents as reinforcing a solar signal.
They write:
The length of a solar cycle is determined as the time from the appearance of the first spot in a cycle at high solar latitude, to the disappearance of the last spot in the same cycle near the solar equator. However, before the last spot in a cycle disappears, the first spot in the next cycle appears at high latitude, and there is normally a two years overlap. The time of the minimum is defined as the central time of overlap between the two cycles (Waldmeier, 1939), and the length of a cycle can be measured between successive minima or maxima. A recent description of how the time of minimum is calculated is given by NGDC (2011): “When observations permit, a date selected as either a cycle minimum or maximum is based in part on an average of the times extremes are reached in the monthly mean sunspot number, in the smoothed monthly mean sunspot number, and in the monthly mean number of spot groups alone. Two more measures are used at time of sunspot minimum: the number of spotless days and the frequency of occurrence of old and new cycle spot groups.”
It was for a long time thought that the appearance of a solar cycle was a random event, which means that each cycle length and amplitude were independent of the previous. However, Dicke (1978) showed that an internal chronometer has to exist inside the Sun, which after a number of short cycles, reset the cycle length so the average length of 11.2 years is kept. Richards et al. (2009) analyzed the length of cycles 1610–2000 using median trace analyses of the cycle lengths and power spectrum analyses of the O–C residuals of the dates of sunspot maxima and minima. They identified a period of 188±38 years. They also found a correspondence between long cycles and minima of number of spots. Their study suggests that the length of sunspot cycles should increase gradually over the next ~75 years. accompanied by a gradual decrease in the number of sunspots.
An autocorrelation study by Solanki et al. (2002) showed that the length of a solar cycle is a good predictor for the maximum sunspot number in the next cycle, in the sense that short cycles predict high Rmax and long cycles predict small Rmax. They explain this with the solar dynamo having a memory of the previous cycle’s length.
Assuming a relation between the sunspot number and global temperature, the secular periodic change of SCL may then correlate with the global temperature, and as long as we are on the ascending (or descending) branches of the 188 year period, we may predict a warmer (or cooler) climate.
It was also demonstrated (Friis-Christensen and Lassen, 1992, Hoyt and Schatten, 1993 and Lassen and Friis-Christensen, 1995) that the correlation between SCL and climate probably has been in operation for centuries. A statistical study of 69 tree rings sets, covering more than 594 years, and SCL demonstrated that wider tree-rings (better growth conditions) were associated with shorter sunspot cycles (Zhou and Butler, 1998).
The British Antarctic Survey has issued a press release regarding the use of a robot submarine which has been measuring the thickness of Antarctic sea ice. The submarine can operate at upto 30m depth and maps the sea ice from underneath. They found that, on average, the thickness of the ice beneath sea level was much greater than previously thought at 1.4 to 5.5m, with the thickest sea ice measured at 16m. They also encountered a lot of highly deformed ice, where one block had ridden over another, increasing the overall draft.
“We suggest that thick ice in the near-coastal and interior pack may be under-represented in existing in situ assessments of Antarctic sea ice and hence, on average, Antarctic sea ice may be thicker than previously thought.”
No doubt some will contort their theories and themselves to show how increased sea ice thickness and greatly increased ice cover in the Antarctic are perfectly consistent with global warming. I am inclined to the much more parsimonious explanation that increased freezing is always a sign of cooling.
The first detailed, high-resolution 3-D maps of Antarctic sea ice have been developed using an underwater robot. Scientists from the UK, USA and Australia say the new technology provides accurate ice thickness measurements from areas that were previously too difficult to access. …
Now, with the Autonomous Underwater Vehicle (AUV) known as SeaBED, scientists have an invaluable new tool to fill this gap.
While most oceanographic survey instruments look down at the seafloor, SeaBED was fitted with an upward-looking sonar in order to measure and map the underside of sea ice floes. The AUV operated at a depth of 20 to 30 meters and was driven in a lawnmower pattern. These lines of data were merged to form high-resolution 3D bathymetric surveys of the underside of the ice.

SeaBed vehicle recovery Photo P. Kimball / Woods Hole Oceanographic Institution
Not only is the amount of sea ice increasing each year, but an underwater robot now shows the ice is also much thicker than was previously thought, a new study reports.
The discovery adds to the ongoing mystery of Antarctica’s expanding sea ice. According to climate models, the region’s sea ice should be shrinking each year because of global warming. Instead, satellite observations show the ice is expanding, and the continent’s sea ice has set new records for the past three winters. At the same time, Antarctica’s ice sheet (the glacial ice on land) is melting and retreating. …….
The findings were published today (Nov. 24) in the journal Nature Geoscience. …..
The sea ice growth around Antarctica has averaged about 1.2 percent to 1.8 percent per decade between 1979 and 2012, according to the 2013 Intergovernmental Panel on Climate Change’s Fifth Assessment Report. The increases are concentrated primarily in the Ross Sea in western Antarctica. Sea ice in the nearby Bellingshausen and Amundsen seas has significantly decreased. Researchers suspect these regional differences could result from stronger winds or increased meltwater from the Antarctic ice sheet, or a combination of both factors.
Global warmists like to pretend sometimes that the Little Ice Age and the Medieval Warm Period were not real or that they were just some local phenomena. The usually point to the lack of data from the southern hemisphere to support their claims. They certainly don’t like to admit that global cooling or warming events could have been caused by solar effects which were perhaps connected to the level of solar activity (as indicated by sunspots). New work at the University of Gloucestershire shows that not only was the Little Ice Age real but that it was present in both hemispheres. And that it was probably due to solar effects
AlphaGalileo reports:
UK researchers show Little Ice Age was global, wit.h implications for current Global Warming
Under embargo until 20 November 2014 00:01 GMT
A team of UK researchers has shed new light on the climate of the Little Ice Age, and rekindled debate over the role of the sun in climate change. The new study, which involved detailed scientific examination of a peat bog in southern South America, indicates that the most extreme climate episodes of the Little Ice Age were felt not just in Europe and North America, which is well known, but apparently globally. The research has implications for current concerns over ‘Global Warming’.
Climate sceptics and believers of Global Warming have long argued about whether the Little Ice Age (from c. early 15th to 19th Centuries) was global, its causes, and how much influence the sun has had on global climate, both during the Little Ice Age and in recent decades. This new study helps clarify those debates.
The team of researchers, from the Universities of Gloucestershire, Aberdeen and Plymouth, conducted studies on past climate through detailed laboratory examination of peat from a bog near Ushuaia, Tierra del Fuego. They used exactly the same laboratory methods as have been developed for peat bogs in Europe. Two principal techniques were used to reconstruct past climates over the past 3000 years: at close intervals throughout a vertical column of peat, the researchers investigated the degree of peat decomposition, which is directly related to climate, and also examined the peat matrix to reveal the changing amounts of different plants that previously grew on the bog.
The data show that the most extreme cold phases of the Little Ice Age—in the mid-15th and then again in the early 18th centuries—were synchronous in Europe and South America. There is one stark difference: while in continental north-west Europe, bogs became wetter, in Tierra del Fuego, the bog became drier—in both cases probably a result of a dramatic equator-ward shift of moisture-bearing winds.
These extreme times coincide with periods when it is known that the sun was unusually quiet. In the late 17th to mid-18th centuries it had very few sunspots—fewer even than during the run of recent cold winters in Europe, which other UK scientists have linked to a relatively quiet sun.
Professor Frank Chambers, Head of the University of Gloucestershire’s Centre for Environmental Change and Quaternary Research, who led the writing of the Fast-Track Research Report, said:
“Both sceptics and adherents of Global Warming might draw succour from this work. Our study is significant because, while there are various different estimates for the start and end of the Little Ice Age in different regions of the world, our data show that the most extreme phases occurred at the same time in both the Northern and Southern Hemispheres. These extreme episodes were abrupt global events. They were probably related to sudden, equator-ward shifts of the Westerlies in the Southern Hemisphere, and the Atlantic depression tracks in the Northern Hemisphere. The same shifts seem to have happened abruptly before, such as c. 2800 years ago, when the same synchronous but opposite response is shown in bogs in Northwest Europe compared with southern South America.
“It seems that the sun’s quiescence was responsible for the most extreme phases of the Little Ice Age, implying that solar variability sometimes plays a significant role in climate change. A change in solar activity may also, for example, have contributed to the post Little Ice Age rise in global temperatures in the first half of the 20th Century. However, solar variability alone cannot explain the post-1970 global temperature trends, especially the global temperature rise in the last three decades of the 20th Century, which has been attributed by the Inter-Governmental Panel on Climate Change (IPCC) to increased concentrations of greenhouse gases in the atmosphere.”
Professor Chambers concluded: “I must stress that our research findings are only interpretable for the period from 3000 years ago to the end of the Little Ice Age. That is the period upon which our research is focused. However, in light of our substantiation of the effects of ‘grand solar minima’ upon past global climates, it could be speculated that the current pausing of ‘Global Warming’, which is frequently referenced by those sceptical of climate projections by the IPCC, might relate at least in part to a countervailing effect of reduced solar activity, as shown in the recent sunspot cycle.”
One weather event is not climate but climate can only be observed – ultimately – as weather. Climate is an integration of local weather over space and time. Supposed climate change which does not show up as changes to local weather to give conditions which lie outside the range of normal variability of that local weather, is no change.
Anthropogenic global warming when it is a conclusion which can only be based on “adjusting” raw data or is only that predicted by a model, but which cannot be actually observed, is of little relevance and of no importance. It is certainly a rather stupid basis for policy.
There has been no global warming of any kind (anthropogenic or otherwise) – even with adjusted data – for over 18 years. The anthropogenic component – supposed to be due to on man-made emissions of carbon dioxide – is not discernible, even though carbon dioxide emissions from fossil fuel combustion have increased by some 70% in that time.
The politically correct “policy” of reducing fossil fuel combustion would seem to be of no significance and of little relevance. This particular weather event in North America only adds to the body of evidence that is not consistent with global warming.
Reuters: All 50 U.S. states feeling freezing temperatures
Temperatures in all 50 U.S. states dipped to freezing or below on Tuesday as an unseasonably cold blast of weather moved across the country, while heavy snow prompted a state of emergency in western New York.
In the U.S. South, states were bracing for a record chill from the Arctic-born cold that swept the Rocky Mountains last week.
Every U.S. state, including Hawaii, was bitten by temperatures at the freezing point of 32 degrees F (0 C) or below, the National Weather Service (NWS) said.
Rational argument cannot penetrate faith.
Ask for evidence and you get model results. Ask for proof that the models are valid and you get hindcasts based on adjusted data. Ask for evidence of man-made emissions causing global warming and the answer is that it must be so for there is no other explanation. There isn’t if you don’t want to see it.
The IPCC believes that model results – even where the models are wrong – provide “conclusive” evidence of not just man-made global warming but that it is due to the emissions of carbon dioxide. It is politics not science. And the politics from India and China have ensured that the IPCC accepts fossil fuels till 2100!!!
For there is – in fact – no actual evidence in the form of data or measurements. There are only model results. There are only model forecasts where the track record shows that every IPCC forecast has been wrong. Fossil fuels – especially gas – will be around and will continue for many hundreds of years unless cheap fusion comes earlier.
Instead of real data showing support for the models, the evidence is accumulating that not only are the models wrong, but also that there are more indications that a global cooling is underway rather than global warming. Real measurements and real data show:
Add to this that a VEI5+ volcano eruption has not occurred since 1991 and is long overdue. It will most likely show up along the Pacific Ring of Fire or in Indonesia. Consider also that the Bárðarbunga volcano in Iceland has been producing sulphur dioxide at a rate which in 9 weeks has pumped twice as much SO2 into the atmosphere than all of Europe does in a year. Bárðarbunga volcano is far from VEI5+ levels and the eruption could continue for months. The SO2 emissions are not all reaching the stratosphere but will surely lead to increased cloud formation around sulphur aerosols and cloud levels will probably be high through at least next year. It becomes increasingly clear that further cooling effects are already in the “natural” pipeline of events. Some new glacier formation has been observed in the Scottish highlands. Some Alpine and Himalayan glaciers have started to increase and while others still decrease, the observation of increase where there has been none before is highly significant. The Great lakes have seen unprecedentedly high ice cover levels. Snow cover in the northern hemisphere is high and is lasting longer into spring than for some time.
But the models and the presuppositions and the misconceptions of the religious high priests cannot be easily denied by the faithful and have an inertia of their own. The IPCC remains delusional and in denial about reality. It continues to play its global warming fiddle but it is badly out of tune and its alarmist cacophony is being overtaken by real events.
It may not be a glacial age that is starting but another Little Ice Age looks like it is on its way.
Where is the real evidence of man-made global warming? Where are the signs? Where are the measurements?
The simple fact is that in spite of what computer models might say, without global warming, there is no man-made global warming.
I am more persuaded by evidence than by climate models which have only demonstrated that they do not work. The man-made global warming hypothesis has a number of crucial assumptions which are all proving to be unproven, lacking evidence or just plain wrong.
Every one of these assumptions is suspect and- at best – uncertain.
“Global Warming” has warped to be “Climate Change” so that any slightly unusual weather event can be claimed to be man-made. The hypotheses are never falsifiable. But the bottom line remains that all the change can be put down to man-made emissions which increase the heat trapped on earth, which then cause global temperatures to rise and fuel the “climate changes” observed. But all man-made climate change vanishes without man-made global warming to power it.
The signs of global warming were touted as being ice melting, sea level rising, loss of polar wildlife and sundry other secondary catastrophes. The poster-children of the global warming religion were the loss of polar ice, the corresponding rise of sea levels, disappearing islands, and the extinction of polar bears.
Just consider the real evidence.
Antarctic sea ice cover has reached the highest levels ever measured and has reached record levels for each of the last 3 years
NSIDC: This year’s Antarctic sea ice maximum was 1.54 million square kilometers (595,000 square miles) above the 1981 to 2010 average maximum extent, which is nearly four standard deviations above this average. The 2014 ice extent record is 560,000 square kilometers (216,000 square miles) above the previous record ice extent set on October 1, 2013. Each of the last three years (2012, 2013, and 2014) has set new record highs for extent in the Antarctic.
Arctic sea ice cover has recovered from the low of 2012 and is now within the 2SD band of the 1981-2010 average. It is up 84% from 2012 and the trend is upwards.
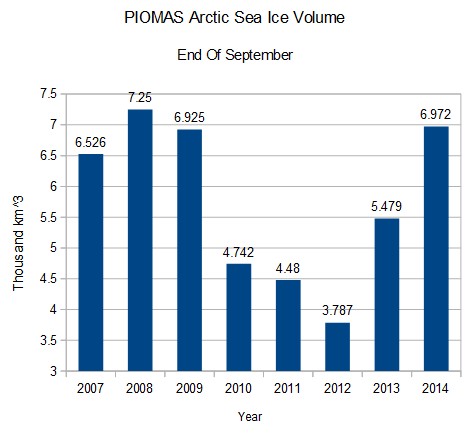
The trend for Arctic ice is upwards
Global sea ice cover is unchanged and shows no discernible trend since 1979.

Global temperatures have not risen for 18 years. In recent years there may even be a cooling trend.
Forbes:Remote Sensing Systems(RSS) also compiles data from the satellite instruments, though RSS measures a slightly different range of the lower atmosphere. RSS reports a similar temperature history,available here. In the RSS compilation, we see not just a recent temperature plateau, but actual cooling. Again, the pace of warming throughout the entirety of the record is approximately 1 degree Celsius per century.
In the last 18 years man made carbon emissions have increased by about 70%. Over the same period carbon dioxide concentration in the atmosphere has risen by about 10% and global temperatures have not risen at all. On this data there is no correlation between global temperature and carbon dioxide concentration let alone carbon dioxide emissions.
Polar bear numbers are higher than for 50 years and walrus numbers are very high as well.
Sea level increases are no higher than the long term rise due to coming out of a glacial age. A rise of 2 inches by 2050 is on the cards.