Archive for the ‘Solar science’ Category

A cluster of low sunspot cycles could be a factor ending the current interglacial

February 14, 2019

The 24th Solar Sunspot Cycle since 1755 is coming to an end. These cycles are nominally of 11 years and this cycle started in December 2008. While the Sun is spotless today, trough conditions will likely extend into at least next year. The designated “start” of Cycle 25 will not be determined for a few years yet but is likely to be in 2020 or 2021.

Dr. David Hathaway retired from NASA’s Ames Research Center in 2016 but now runs a Solar site of his own. He writes

Solar Cycle 25 Prediction. We find that the polar fields indicate that Cycle 25 will be similar in size to (or slightly smaller than) the current small cycle, Cycle 24. Small cycles, like Cycle 24, start late and leave behind long cycles with deep extended minima. Therefore, we expect a similar deep, extended minimum for the Cycle 24/25 minimum in 2020.

Hathaway – cycle 25 prediction

Actual sunspot numbers for cycle 24 are shown here

Cycle 24 actual

Cycles 24 and 25 will show very low values. Whether something similar to the Maunder Minimum actually results remains to be seen. Nevertheless, sunspot number values are going to be low till at least 2033 when Cycle 26 enters its growth phase. If Cycle 26 also turns out to be a low sunspot number cycle, it may well portend not just a little ice age but even be an indicator that this interglacial period is coming to an end.

We don’t know what triggers the change of conditions to and from an interglacial. The transition time is likely at least a few decades and more probably a few hundred years. There are probably many “triggers” needed simultaneously to end an interglacial, but a a few very low sunspot cycles clustered together could well be one of the important ingredients. The current interglacial has lasted longer than usual. A glacial period within the next 1,000 years is almost a certainty.


Hurricane activity IS linked to solar cycles

September 9, 2017
Hurricane activity IS connected to the solar cycle.
………. years with positive SSN anomalies featuring high peripheral month sunspot numbers but low in-season numbers have, on average, significantly more (79%) US hurricanes. The SSN anomaly was shown to be statistically significant in models for US hurricanes and US major hurricanes after accounting for the other climate variables.
We are coming to the end of Solar Cycle 24 (“low in-season numbers”) but are seeing some major solar storm activity. It would seem that the conditions for hight hurricane activity are again fulfilled.
In 2010, the hurricane image was remarkably like the one being currently seen.

2010 Vs 2017 Hurricanes (image Fox)

Even before the 2010 hurricane season, this article in the International Journal of Climatology found a clear connection with the Sea Surface temperature (SST) and the solar cycle.
Abstract:
The relationship between US hurricanes and solar activity is investigated empirically. First, a relationship between the probability of a US hurricane and the solar cycle is shown conditional on sea surface temperatures (SST). For years of above normal SST, the probability of three or more US hurricanes decreases from 40 to 20% as sunspot numbers (SSN) increase from lower to upper quartile amounts. Second, since SST is in phase with the 11-year total solar irradiance cycle but upper-air temperature is in phase with ultraviolet radiation changes on the monthly time scale, an anomaly index of SSN is constructed. The index is significantly correlated with US hurricanes and major US hurricanes over the period 1866-2008. The chances of at least one hurricane affecting the United States in the lowest and highest SSN anomaly seasons are 68 and 91%, respectively. A similar relationship is noted using hurricane records spanning the period 1749-1850, providing independent corroborating evidence linking solar variability to the probability of a US hurricane.
Right now we are approaching the end of Solar Cycle 24

Solar Cycle 22 to 24 (image Hathaway NASA/Marshall)

The Sun is the ultimate driver of climate. 
As the authors write in their conclusions
The evidence for a sun–hurricane relationship was further bolstered by showing that a similar relationship between the SSN anomaly and US hurricanes (years of high SSN anomaly have more US hurricanes) is detectable in an archive of Atlantic hurricanes dating back to 1749. ………. 

A model to explain the end of an ice age (but not yet to predict when one may start)

February 23, 2017

That the onset of glacial (cold) and interglacial (warm) periods on earth are a consequence of the Milankovitch cycles is almost certain. Researchers have now developed a model which seems to be able to explain why and when glacial periods end to give interglacial conditions. Exactly what cause glacial conditions to be triggered remains to be discovered.

P. C. Tzedakis, M. Crucifix, T. Mitsui, E. W. Wolff. A simple rule to determine which insolation cycles lead to interglacials. Nature, 2017; 542 (7642): 427 DOI: 10.1038/nature21364
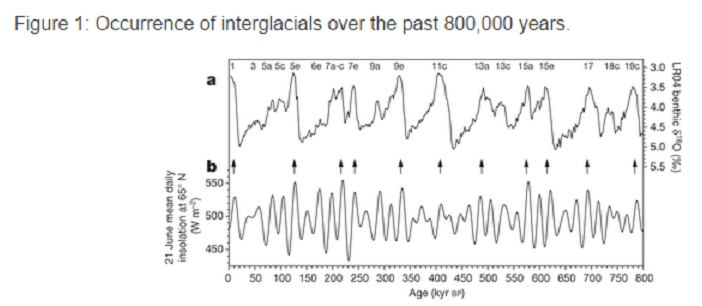
AbstractThe pacing of glacial–interglacial cycles during the Quaternary period (the past 2.6 million years) is attributed to astronomically driven changes in high-latitude insolation. However, it has not been clear how astronomical forcing translates into the observed sequence of interglacials. Here we show that before one million years ago interglacials occurred when the energy related to summer insolation exceeded a simple threshold, about every 41,000 years. Over the past one million years, fewer of these insolation peaks resulted in deglaciation (that is, more insolation peaks were ‘skipped’), implying that the energy threshold for deglaciation had risen, which led to longer glacials. However, as a glacial lengthens, the energy needed for deglaciation decreases. A statistical model that combines these observations correctly predicts every complete deglaciation of the past million years and shows that the sequence of interglacials that has occurred is one of a small set of possibilities. The model accounts for the dominance of obliquity-paced glacial–interglacial cycles early in the Quaternary and for the change in their frequency about one million years ago. We propose that the appearance of larger ice sheets over the past million years was a consequence of an increase in the deglaciation threshold and in the number of skipped insolation peaks.

Onset of Interglacials Tzedakis et al

Onset of Interglacials Tzedakis et al

Science Daily reports:

…. In a new study published today in Nature, researchers from UCL (University College London), University of Cambridge and University of Louvain have combined existing ideas to solve the problem of which solar energy peaks in the last 2.6 million years led to the melting of the ice sheets and the start of a warm period.

During this interval, Earth’s climate has alternated between cold (glacial) and warm (interglacial) periods. In the cold times, ice sheets advanced over large parts of North America and northern Europe. In the warm periods like today, the ice sheets retreated completely.

It has long been realised that these cycles were paced by astronomical changes in the Earth’s orbit around the Sun and in the tilt of its axis, which change the amount of solar energy available to melt ice at high northern latitudes in summer.

However, of the 110 incoming solar energy peaks (about every 21,000 years) only 50 led to complete melting of the ice sheets. Finding a way to translate the astronomical changes into the sequence of interglacials has previously proved elusive. 

Professor Chronis Tzedakis (UCL Geography) said: “The basic idea is that there is a threshold for the amount of energy reaching high northern latitudes in summer. Above that threshold, the ice retreats completely and we enter an interglacial.”

From 2.6 to 1 million years ago, the threshold was reached roughly every 41,000 years, and this predicts almost perfectly when interglacials started and the ice sheets disappeared. Professor Eric Wolff (University of Cambridge) said: “Simply put, every second solar energy peak occurs when the Earth’s axis is more inclined, boosting the total energy at high latitudes above the threshold.”

Somewhere around a million years ago, the threshold rose, so that the ice sheets kept growing for longer than 41,000 years. However, as a glacial period lengthens, ice sheets become larger, but also more unstable.

The researchers combined these observations into a simple model, using only solar energy and waiting time since the previous interglacial, that was able to predict all the interglacial onsets of the last million years, occurring roughly every 100,000 years.

Dr Takahito Mitsui (University of Louvain) said: “The next step is to understand why the energy threshold rose around a million years ago — one idea is that this was due to a decline in the concentration of CO2, and this needs to be tested.”

The results explain why we have been in a warm period for the last 11,000 years: despite the weak increase in solar energy, ice sheets retreated completely during our current interglacial because of the very long waiting time since the previous interglacial and the accumulated instability of ice sheets. …..

Milankovitch Cycles (Wikipedia)

What would cause the current interglacial to end remains to be discovered. It’s only my speculation of course but I suspect that a trigger event is probably needed. Possibly 2 or 3 major (VEI >6) volcanic eruptions over a short period, with large amounts of dust, which in turn led to a a few “years without summers”, could provide such a trigger for an unstoppable process. However the onset of full glacial conditions would still take a few thousand years. The availability of high energy densities would probably make it (relatively) easy for humans to continue to thrive and prosper (as they have done through other glacial periods with much lower energy availability).


Solar Cycle 24 approaches minimum (the Landscheidt Minimum?)

September 4, 2016

Vencore: The current solar cycle, #24, is the weakest solar cycle in more than a century and it is now heading towards the next solar minimum phase which would be the beginning of solar cycle #25.  The last solar minimum phase lasted from 2007 to 2009 and it was historically weak. …… The current solar cycle is the 24th solar cycle since 1755 when extensive recording of solar sunspot activity began.  Solar cycle 24 is currently on pace to be the weakest sunspot cycle with the fewest sunspots since cycle 14 peaked in February 1906. Solar cycle 24 continues a recent trend of weakening solar cycles which began with solar cycle 22 that peaked around 1990.

In January this year, sunspot activity was declining sharply with the minimum expected around 2019/2010 (last minimum was in 2008/2009). SC24 maximum was reached in 2014 (the second of two peaks with the first in 2012).

SC24 january 2016 (Hathaway-NASA)

SC24 january 2016 (Hathaway-NASA)

Whether we shall see the coming minimum  (the Landscheidt Minimum) to be like the Dalton Minimum or a Grand Minimum like the Maunder Minimum remains to be seen. It should be clear by the time of the SC25 maximum around 2024/2025 and the next minimum in 2030.

It really is time to acknowledge the Landscheidt Minimum:

Landscheidt also predicted that after the next solar minimum in 2030 the following minimum would occur in 2200.

It is perhaps time to officially name this minimum that is coming as the “Landscheidt Minimum”.

The latest SC 24 plot of sunspot number has been posted by NASA/Hathaway:

SC24 august 2016 (Hathaway-NASA)

SC24 august 2016 (Hathaway-NASA)

We are in for 3 decades of cooling.


It has always been the Sun as new model predicts another ice age

July 12, 2015

I can see the evidence that the earth goes through warming and cooling cycles. But I have seen no evidence that man-made carbon dioxide emissions have had any significant impact on global climate in general or on global warming in particular. I am more inclined to the view that our climate is overwhelmingly dominated by the Sun – both directly with insolation variations and indirectly through the clouds and the oceans. Solar activity indicates we are approaching – or have arrived at – a new minimum, the Landscheidt Minimum – which will be similar to the Maunder Minimum. Another Little Ice Age in the next decade or two has always been on the cards.

(On a longer timescale, I believe a large volcanic eruption could be one of the possible triggers which tips the earth from interglacial to glacial conditions and our current interglacial cannot last more than another millennium or so.)

Now another model of the suns activity level also suggests that a Maunder-like Minimum and another Little Ice Age is just around the corner.

PhysOrg:

A new model of the Sun’s solar cycle is producing unprecedentedly accurate predictions of irregularities within the Sun’s 11-year heartbeat. The model draws on dynamo effects in two layers of the Sun, one close to the surface and one deep within its convection zone. Predictions from the model suggest that solar activity will fall by 60 per cent during the 2030s to conditions last seen during the ‘mini ice age’ that began in 1645. Results will be presented today by Prof Valentina Zharkova at the National Astronomy Meeting in Llandudno.

It is 172 years since a scientist first spotted that the Sun’s activity varies over a cycle lasting around 10 to 12 years. But every cycle is a little different and none of the models of causes to date have fully explained fluctuations. Many solar physicists have put the cause of the solar cycle down to a dynamo caused by convecting fluid deep within the Sun. Now, Zharkova and her colleagues have found that adding a second dynamo, close to the surface, completes the picture with surprising accuracy.

“We found magnetic wave components appearing in pairs, originating in two different layers in the Sun’s interior. They both have a frequency of approximately 11 years, although this frequency is slightly different, and they are offset in time. Over the cycle, the waves fluctuate between the northern and southern hemispheres of the Sun. Combining both waves together and comparing to real data for the current solar cycle, we found that our predictions showed an accuracy of 97%,” said Zharkova.

Zharkova and her colleagues derived their model using a technique called ‘principal component analysis’ of the magnetic field observations from the Wilcox Solar Observatory in California. They examined three solar cycles-worth of magnetic field activity, covering the period from 1976-2008. In addition, they compared their predictions to average sunspot numbers, another strong marker of solar activity. All the predictions and observations were closely matched.

Looking ahead to the next solar cycles, the model predicts that the pair of waves become increasingly offset during Cycle 25, which peaks in 2022. During Cycle 26, which covers the decade from 2030-2040, the two waves will become exactly out of synch and this will cause a significant reduction in solar activity. 

“In cycle 26, the two waves exactly mirror each other – peaking at the same time but in opposite hemispheres of the Sun. Their interaction will be disruptive, or they will nearly cancel each other. We predict that this will lead to the properties of a ‘Maunder minimum’,” said Zharkova. “Effectively, when the waves are approximately in phase, they can show strong interaction, or resonance, and we have strong solar activity. When they are out of phase, we have solar minimums. When there is full phase separation, we have the conditions last seen during the Maunder minimum, 370 years ago.”

It really is time to acknowledge the Landscheidt Minimum:

Landscheidt also predicted that after the next solar minimum in 2030 the following minimum would occur in 2200.

It is perhaps time to officially name this minimum that is coming as the “Landscheidt Minimum”.


Solar Cycle 24 passes maximum? Low sunspot numbers and climate cooling indicated for next two cycles

February 11, 2015

It is not completely certain but it does look like Solar Cycle 24 has just passed its maximum. The maximum was initially expected to be reached in late 2012 and gradually drifted to late 2013. Now it would seem that this may not have occurred till late 2014.  While the minima at the beginnings of SC 23 and 24 seem to have been c. 12 years apart, the maxima are closer to 14 years apart.

SC24 2015 January  From NASA Hathaway

SC24 2015 January From NASA Hathaway

The length of Solar Cycles is thought to be linked to the solar activity to be expected in the following 2 cycles. Periods much longer than the average of 11.2 years seem to lead to decreased subsequent activity, lower sunspot numbers and also lower global temperatures.

Solheim et al predicted lower sunspot activity and cooler times during SC 24. Now it would seem this will also be the prevailing paradigm through SC25 and perhaps even SC26. Another two decades of reduced sunspot activity and a global cooling carried by the ocean cycles would seem to be on the cards.

Abstract

Relations between the length of a sunspot cycle and the average temperature in the same and the next cycle are calculated for a number of meteorological stations in Norway and in the North Atlantic region. No significant trend is found between the length of a cycle and the average temperature in the same cycle, but a significant negative trend is found between the length of a cycle and the temperature in the next cycle. This provides a tool to predict an average temperature decrease of at least 1.0ºC from solar cycle 23 to solar cycle 24 for the stations and areas analyzed. We find for the Norwegian local stations investigated that 25–56% of the temperature increase the last 150 years may be attributed to the Sun. For 3 North Atlantic stations we get 63–72% solar contribution. This points to the Atlantic currents as reinforcing a solar signal.

They write:

The length of a solar cycle is determined as the time from the appearance of the first spot in a cycle at high solar latitude, to the disappearance of the last spot in the same cycle near the solar equator. However, before the last spot in a cycle disappears, the first spot in the next cycle appears at high latitude, and there is normally a two years overlap. The time of the minimum is defined as the central time of overlap between the two cycles (Waldmeier, 1939), and the length of a cycle can be measured between successive minima or maxima. A recent description of how the time of minimum is calculated is given by NGDC (2011): “When observations permit, a date selected as either a cycle minimum or maximum is based in part on an average of the times extremes are reached in the monthly mean sunspot number, in the smoothed monthly mean sunspot number, and in the monthly mean number of spot groups alone. Two more measures are used at time of sunspot minimum: the number of spotless days and the frequency of occurrence of old and new cycle spot groups.”

It was for a long time thought that the appearance of a solar cycle was a random event, which means that each cycle length and amplitude were independent of the previous. However, Dicke (1978) showed that an internal chronometer has to exist inside the Sun, which after a number of short cycles, reset the cycle length so the average length of 11.2 years is kept. Richards et al. (2009) analyzed the length of cycles 1610–2000 using median trace analyses of the cycle lengths and power spectrum analyses of the O–C residuals of the dates of sunspot maxima and minima. They identified a period of 188±38 years. They also found a correspondence between long cycles and minima of number of spots. Their study suggests that the length of sunspot cycles should increase gradually over the next ~75 years. accompanied by a gradual decrease in the number of sunspots.

An autocorrelation study by Solanki et al. (2002) showed that the length of a solar cycle is a good predictor for the maximum sunspot number in the next cycle, in the sense that short cycles predict high Rmax  and long cycles predict small Rmax. They explain this with the solar dynamo having a memory of the previous cycle’s length.

Assuming a relation between the sunspot number and global temperature, the secular periodic change of SCL may then correlate with the global temperature, and as long as we are on the ascending (or descending) branches of the 188 year period, we may predict a warmer (or cooler) climate.

It was also demonstrated (Friis-Christensen and Lassen, 1992, Hoyt and Schatten, 1993 and Lassen and Friis-Christensen, 1995) that the correlation between SCL and climate probably has been in operation for centuries. A statistical study of 69 tree rings sets, covering more than 594 years, and SCL demonstrated that wider tree-rings (better growth conditions) were associated with shorter sunspot cycles (Zhou and Butler, 1998).

Little Ice Age was due to low solar irradiance

March 10, 2014

The Sun is the only real source of energy available at the surface of the earth (and any heat from nuclear reactions at the earth’s core is extremely small if not completely negligible). That the oceans have a much higher heat capacity than the atmosphere at the surface of the earth is obvious. It seems also fairly clear to me that it is the dynamics of ocean – atmosphere interactions which control climate and weather. And it is the oceans and long time scales which dominate climate while it is the atmospheric variations and short time scales which determine weather.

But the driver is always the Sun.

A new paper in Nature GeoScience “used seafloor sediments taken from south of Iceland to study changes in the warm surface ocean current. This was done by analysing the chemical composition of fossilised microorganisms that had once lived in the surface of the ocean. These measurements were then used to reconstruct the seawater temperature and the salinity of this key ocean current over the past 1000 years.”

The researchers found that ” low solar irradiance promotes the development of frequent and persistent atmospheric blocking events, in which a quasi-stationary high-pressure system in the eastern North Atlantic modifies the flow of the westerly winds. We conclude that this process could have contributed to the consecutive cold winters documented in Europe during the Little Ice Age.”

Paola Moffa-Sánchez, Andreas Born, Ian R. Hall, David J. R. Thornalley, Stephen Barker. Solar forcing of North Atlantic surface temperature and salinity over the past millenniumNature Geoscience, 2014; DOI: 10.1038/ngeo2094

AbstractThere were several centennial-scale fluctuations in the climate and oceanography of the North Atlantic region over the past 1,000 years, including a period of relative cooling from about AD 1450 to 1850 known as the Little Ice Age. These variations may be linked to changes in solar irradiance, amplified through feedbacks including the Atlantic meridional overturning circulation. Changes in the return limb of the Atlantic meridional overturning circulation are reflected in water properties at the base of the mixed layer south of Iceland. Here we reconstruct thermocline temperature and salinity in this region from AD 818 to 1780 using paired δ18O and Mg/Ca ratio measurements of foraminifer shells from a subdecadally resolved marine sediment core. The reconstructed centennial-scale variations in hydrography correlate with variability in total solar irradiance. We find a similar correlation in a simulation of climate over the past 1,000 years. We infer that the hydrographic changes probably reflect variability in the strength of the subpolar gyre associated with changes in atmospheric circulation. Specifically, in the simulation, low solar irradiance promotes the development of frequent and persistent atmospheric blocking events, in which a quasi-stationary high-pressure system in the eastern North Atlantic modifies the flow of the westerly winds. We conclude that this process could have contributed to the consecutive cold winters documented in Europe during the Little Ice Age.

Cardiff University Press Release:

Changes in the sun’s energy output may have led to marked natural climate change in Europe over the last 1000 years, according to researchers at Cardiff University. The study found that changes in the Sun’s activity can have a considerable impact on the ocean-atmospheric dynamics in the North Atlantic, with potential effects on regional climate.

Scientists studied seafloor sediments to determine how the temperature of the North Atlantic and its localised atmospheric circulation had altered. Warm surface waters flowing across the North Atlantic, an extension of the Gulf Stream, and warm westerly winds are responsible for the relatively mild climate of Europe, especially in winter. Slight changes in the transport of heat associated with these systems can lead to regional climate variability, and the study findings matched historic accounts of climate change, including the notoriously severe winters of the 16th and 18th centuries which pre-date global industrialisation.

The study found that changes in the Sun’s activity can have a considerable impact on the ocean-atmospheric dynamics in the North Atlantic, with potential effects on regional climate.

Predictions suggest a prolonged period of low sun activity over the next few decades ……..

Though their study has nothing whatever to do with global warming and any man-made effects they still feel it necessary to add this caveat (presumably because the reviewers, and the Journal, or both, insisted).

Predictions suggest a prolonged period of low sun activity over the next few decades, but any associated natural temperature changes will be much smaller than those created by human carbon dioxide emissions, say researchers.

The sun dances to its own tune with unexpectedly high activity in February

March 4, 2014

There is more we don’t know that we don’t know that we don’t know. (with apologies to Donald Rumsfeld).

While Solar Cycle 24 is still showing the lowest sunspot activity in 100 years, its activity during February was unexpectedly high.  And we don’t really know why.

SC24 Feb 2014 graphic NOAA data from informthpundits

SC24 Feb 2014 graphic NOAA data from informthepundits

The increased activity in February was certainly not expected but SC24 still remains at a very low activity level compared to recent Solar Cycles.

SC21 - SC24 from solen.info

SC21 – SC24 from solen.info

It is a little too early to see if the similarities with Solar Cycles 5 and 6 (during the time of the Dalton Minimum) will hold up and lead us into another Little Ice Age. Or whether this Landscheidt Minimum will just lead to a 30 year cooling period without quite producing a Little Ice Age.

Interesting times.

The Sun will continue to dance to its own tune and we will make believe that we know what it is doing.

But we ignore the Sun at our peril.

One cold wave is not proof of Global Cooling, but ….

January 9, 2014


One cold wave is not proof of Global Cooling,

Even if polar ice is now steadily increasing,

But a quiescent Sun is in another Minimum,

And AGW theory suffers a diverticulum,

For Climate Change is changing to a Cooling from a Warming.

From CBN News:

Global Cooling: Is an Ice Age Coming?

The fact that Arctic ice is growing may not be the good news that it seems to be. There are signs that the Earth is entering a very unpleasant cooling period. Sunspot activity remains very low.

“The sun has been very unusual for almost 15 years now,” Jens Pedersen, senior scientist at the Denmark’s Technical University, said.

Pedersen said the sun recently reached solar maximum and that there should be a lot of sunspot activity, but there isn’t.

“We have to go back 100 years to find a solar maximum that was as weak as the one we are in right now,” he told CBN News. “And the recent solar minimum…one has to go back 200 years to find one that was as weak.”

The last time the sun was this quiet, North America and Europe suffered through a weather event from the 1600s to the 1800s known as “Little Ice Age,” when the Thames River in London regularly froze solid, and North America saw terrible winters. Crops failed and people starved.

Pedersen said climate scientists know the Earth stopped warming 15 years ago. But the United Nations Intergovernmental Panel on Climate Change, of which Pedersen is an expert reviewer, suppressed a recent report from its own scientists that the U.N.’s climate model has been proven wrong.

“In particular one of the issues has been why global warming has stopped during the last 15 years, and climate scientists were very frank that the climate models do not match the climate we observe,” Pedersen said.

But politicians removed that embarrassing finding from the final draft.  It’s as if the alleged danger from climate change can’t be wrong because it is now too important.

It has become a political movement, a cash cow for climate scientists and environmental groups, and a way for world leaders to control economies and people.

“It’s a political agenda,” Dan Gainor, vice president of business and culture at the Media Research Center, said. “When you look at what the government will be able to do with climate change, it gives them (access) into every aspect of our lives.” ….. 

Related: https://ktwop.wordpress.com/tag/landscheidt-minimum/

Solar and ocean cycles – without any CO2 influence – are sufficient to explain climate changes

December 7, 2013
  1. The de Vries solar cycle together with the AMO/PDO are sufficient to explain the main climate variations of the last 1000 years
  2. It is unnecessary to invoke carbon dioxide and its effects to explain the climate cycles
  3. The 21st century will see an underlying cooling due to the de Vries cycle and then modulated by the AMO/PDO. 

The 200-210 year de Vries solar cycle (also known as the Suess cycle)  has been postulated for some time (here and here for example)  as being one of the main natural cycles governing our climate.  The effect of the de Vries cycle can be traced back through the glacial record through many millenia and even through geologic ages. Many solar effects work on climate through ocean cycles. The Atlantic/Pacific Oscillations are well known as  drivers of climate and can be traced back through at least about 1500 years. The Atlantic Multidecadal Oscillation (AMO) has a period of about 66 years while the Pacific Decadal Oscillation (PDO) has a slightly shorter cycle of 60 years.

The entire hypothesis that carbon dioxide concentrations in the atmosphere and therefore human emissions of carbon dioxide are responsible for “global warming” is based on the argument that nothing else can explain the warming witnessed during the 20th century. Yet this is not just conjecture it is a fantasy based on ignoring the effect of the natural cycles that are known to exist. In fact there is no need to invoke carbon dioxide concentration to explain the ups and down of climate. German researchers have now shown that just the de Vries Cycle together with the AMO and the PDO are quite sufficient. The period in the 1970’s and 1980’s often used as the foundation for “global warming” theory can be quite sufficiently explained by the AMO/PDO.

Just as we had about 100 years of an underlying warming due to the de Vries cycle in the 20th century, we are in for an underlying cooling through the 21st century in response to the de Vries solar cycle. This underlying trend will be modulated by the ups and downs of the AMO and the PDO. Carbon dioxide concentrations are largely irrelevant. 

The following is from an article at NoTricksZone:

German Scientists Show Climate Driven By Natural Cycles – Global Temperature To Drop To 1870 Levels By 2100!

by Prof. H. Luedecke and C.O. Weiss (Original German version here).

We reported recently about our spectral analysis work of European temperatures [1] which shows that during the last centuries all climate changes were caused by periodic (i.e. natural) processes. Non-periodic processes like a warming through the monotonic increase of CO2 in the atmosphere could cause at most 0.1° to 0.2° warming for a doubling of the CO2 content, as it is expected for 2100.

Fig. 1 (Fig. 6 of [1] ) shows the measured temperatures (blue) and the temperatures reconstructed using the 6 strongest frequency components (red) of the Fourier spectrum, indicating that the temperature history is determined by periodic processes only.

On sees from Fig. 1 that two cycles of periods 200+ years and ~65 years dominate the climate changes, the 200+ year cycle causing the largest part of the temperature increase since 1870.

EIKE_2

Fig. 1: Construction of temperatures using the 6 strongest Fourier components (red), European temperatures from instrumental measurements (blue). It is apparent that only a 200+ year cycle and a ~65 year cycle play a significant role.

The ~65 year cycle is the well-known, much studied, and well understood “Atlantic/Pacific oscillation” (AMO/PDO).  It can be traced back for 1400 years. The AMO/PDO has no external forcing it is “intrinsic dynamics”, an “oscillator”.

Although the spectral analysis of the historical instrumental temperature measurements [1] show a strong 200+ year period, it cannot be inferred with certainty from these measurements, since only 240 years of measurement data are available. However, the temperatures obtained from the Spannagel stalagmite show this periodicity as the strongest climate variation by far since about 1100 AD.

……….

Summary

The analysis of solar activity proves the existence and the strength of the 200+ year periodicity which we found from historical temperature measurements, as well as from the Spannagel stalagmite data. This 200+ year cycle is apparently the one known as “de Vries cycle”.

This solar “de Vries cycle together with the AMO/PDO determine practically completely the global climate of the past  (Fig. 1) and the coming time. A significant influence of CO2 on the climate thus has to be excluded. This latter is not surprising in view of the small amount of CO2 in the atmosphere and its weak infrared absorption cross section (also in view of the various proves of NEGATIVE water feedback).

The present “stagnation” of global temperature (Fig. 5) is essentially due to the AMO/PDO: the solar de Vries cycle is presently at its maximum. Around this maximum it changes negligibly. The AMO/PDO is presently beyond its maximum, corresponding to the small decrease of global temperature. Its next minimum will be 2035. The temperature can expected to be then similar to the last AMO/PDO minimum of 1940. Due to the de Vries cycle, the global temperature will drop until 2100 to a value corresponding to the “little ice age” of 1870.

It accounts for the long temperature rise since 1870. One may note, that the stronger temperature increase from the 1970s to the 1990s, which is “officially” argued to prove warming by CO2, is essentially due to the AMO/PDO cycle.

[1] H.Luedecke, A. Hempelmann, C.O. Weiss; Clim. Past.  9  (2013) p 447

[2] F. Steinhilber, J. Beer; Journ. Geophys. Res.: Space Physics  118  (2013) p 1861


%d bloggers like this: