Posts Tagged ‘solar cycle’

Hurricane activity IS linked to solar cycles

September 9, 2017
Hurricane activity IS connected to the solar cycle.
………. years with positive SSN anomalies featuring high peripheral month sunspot numbers but low in-season numbers have, on average, significantly more (79%) US hurricanes. The SSN anomaly was shown to be statistically significant in models for US hurricanes and US major hurricanes after accounting for the other climate variables.
We are coming to the end of Solar Cycle 24 (“low in-season numbers”) but are seeing some major solar storm activity. It would seem that the conditions for hight hurricane activity are again fulfilled.
In 2010, the hurricane image was remarkably like the one being currently seen.

2010 Vs 2017 Hurricanes (image Fox)

Even before the 2010 hurricane season, this article in the International Journal of Climatology found a clear connection with the Sea Surface temperature (SST) and the solar cycle.
Abstract:
The relationship between US hurricanes and solar activity is investigated empirically. First, a relationship between the probability of a US hurricane and the solar cycle is shown conditional on sea surface temperatures (SST). For years of above normal SST, the probability of three or more US hurricanes decreases from 40 to 20% as sunspot numbers (SSN) increase from lower to upper quartile amounts. Second, since SST is in phase with the 11-year total solar irradiance cycle but upper-air temperature is in phase with ultraviolet radiation changes on the monthly time scale, an anomaly index of SSN is constructed. The index is significantly correlated with US hurricanes and major US hurricanes over the period 1866-2008. The chances of at least one hurricane affecting the United States in the lowest and highest SSN anomaly seasons are 68 and 91%, respectively. A similar relationship is noted using hurricane records spanning the period 1749-1850, providing independent corroborating evidence linking solar variability to the probability of a US hurricane.
Right now we are approaching the end of Solar Cycle 24

Solar Cycle 22 to 24 (image Hathaway NASA/Marshall)

The Sun is the ultimate driver of climate. 
As the authors write in their conclusions
The evidence for a sun–hurricane relationship was further bolstered by showing that a similar relationship between the SSN anomaly and US hurricanes (years of high SSN anomaly have more US hurricanes) is detectable in an archive of Atlantic hurricanes dating back to 1749. ………. 

Solar and ocean cycles – without any CO2 influence – are sufficient to explain climate changes

December 7, 2013
  1. The de Vries solar cycle together with the AMO/PDO are sufficient to explain the main climate variations of the last 1000 years
  2. It is unnecessary to invoke carbon dioxide and its effects to explain the climate cycles
  3. The 21st century will see an underlying cooling due to the de Vries cycle and then modulated by the AMO/PDO. 

The 200-210 year de Vries solar cycle (also known as the Suess cycle)  has been postulated for some time (here and here for example)  as being one of the main natural cycles governing our climate.  The effect of the de Vries cycle can be traced back through the glacial record through many millenia and even through geologic ages. Many solar effects work on climate through ocean cycles. The Atlantic/Pacific Oscillations are well known as  drivers of climate and can be traced back through at least about 1500 years. The Atlantic Multidecadal Oscillation (AMO) has a period of about 66 years while the Pacific Decadal Oscillation (PDO) has a slightly shorter cycle of 60 years.

The entire hypothesis that carbon dioxide concentrations in the atmosphere and therefore human emissions of carbon dioxide are responsible for “global warming” is based on the argument that nothing else can explain the warming witnessed during the 20th century. Yet this is not just conjecture it is a fantasy based on ignoring the effect of the natural cycles that are known to exist. In fact there is no need to invoke carbon dioxide concentration to explain the ups and down of climate. German researchers have now shown that just the de Vries Cycle together with the AMO and the PDO are quite sufficient. The period in the 1970’s and 1980’s often used as the foundation for “global warming” theory can be quite sufficiently explained by the AMO/PDO.

Just as we had about 100 years of an underlying warming due to the de Vries cycle in the 20th century, we are in for an underlying cooling through the 21st century in response to the de Vries solar cycle. This underlying trend will be modulated by the ups and downs of the AMO and the PDO. Carbon dioxide concentrations are largely irrelevant. 

The following is from an article at NoTricksZone:

German Scientists Show Climate Driven By Natural Cycles – Global Temperature To Drop To 1870 Levels By 2100!

by Prof. H. Luedecke and C.O. Weiss (Original German version here).

We reported recently about our spectral analysis work of European temperatures [1] which shows that during the last centuries all climate changes were caused by periodic (i.e. natural) processes. Non-periodic processes like a warming through the monotonic increase of CO2 in the atmosphere could cause at most 0.1° to 0.2° warming for a doubling of the CO2 content, as it is expected for 2100.

Fig. 1 (Fig. 6 of [1] ) shows the measured temperatures (blue) and the temperatures reconstructed using the 6 strongest frequency components (red) of the Fourier spectrum, indicating that the temperature history is determined by periodic processes only.

On sees from Fig. 1 that two cycles of periods 200+ years and ~65 years dominate the climate changes, the 200+ year cycle causing the largest part of the temperature increase since 1870.

EIKE_2

Fig. 1: Construction of temperatures using the 6 strongest Fourier components (red), European temperatures from instrumental measurements (blue). It is apparent that only a 200+ year cycle and a ~65 year cycle play a significant role.

The ~65 year cycle is the well-known, much studied, and well understood “Atlantic/Pacific oscillation” (AMO/PDO).  It can be traced back for 1400 years. The AMO/PDO has no external forcing it is “intrinsic dynamics”, an “oscillator”.

Although the spectral analysis of the historical instrumental temperature measurements [1] show a strong 200+ year period, it cannot be inferred with certainty from these measurements, since only 240 years of measurement data are available. However, the temperatures obtained from the Spannagel stalagmite show this periodicity as the strongest climate variation by far since about 1100 AD.

……….

Summary

The analysis of solar activity proves the existence and the strength of the 200+ year periodicity which we found from historical temperature measurements, as well as from the Spannagel stalagmite data. This 200+ year cycle is apparently the one known as “de Vries cycle”.

This solar “de Vries cycle together with the AMO/PDO determine practically completely the global climate of the past  (Fig. 1) and the coming time. A significant influence of CO2 on the climate thus has to be excluded. This latter is not surprising in view of the small amount of CO2 in the atmosphere and its weak infrared absorption cross section (also in view of the various proves of NEGATIVE water feedback).

The present “stagnation” of global temperature (Fig. 5) is essentially due to the AMO/PDO: the solar de Vries cycle is presently at its maximum. Around this maximum it changes negligibly. The AMO/PDO is presently beyond its maximum, corresponding to the small decrease of global temperature. Its next minimum will be 2035. The temperature can expected to be then similar to the last AMO/PDO minimum of 1940. Due to the de Vries cycle, the global temperature will drop until 2100 to a value corresponding to the “little ice age” of 1870.

It accounts for the long temperature rise since 1870. One may note, that the stronger temperature increase from the 1970s to the 1990s, which is “officially” argued to prove warming by CO2, is essentially due to the AMO/PDO cycle.

[1] H.Luedecke, A. Hempelmann, C.O. Weiss; Clim. Past.  9  (2013) p 447

[2] F. Steinhilber, J. Beer; Journ. Geophys. Res.: Space Physics  118  (2013) p 1861

Solar Cycle 24’s double peak is not over yet

November 4, 2013

I thought we had reached solar maximum (albeit at a very low level) for this Solar Cycle 24 about a month ago with a double peak apparently having been evident in May. But the recent burst of solar activity during October suggests that the double peak may not be quite over yet.

SC24 sunspot activity October 2013

SC24 sunspot activity October 2013

Nasa’s prediction for SC24  (Wilson, Hathaway, and Reichmann) now looks like this:

SC24 prediction November 2013

SC24 prediction November 2013

Solar Maximum which was expected this fall may be somewhat delayed and might even be pushed back to the end of 2013.

The activity levels are still historically low and if SC 25 continues at very low levels then we will be getting close to the conditions of the Dalton and perhaps the Maunder Minimum. The sequence of solar cycles SC23,24 and 25 (Landscheidt Minimum) are then to be compared to the sequence of cycles SC4,5 and 6 for the Dalton Minimum whereas the Maunder Minimum corresponds to the period before solar cycle numbering started (prior to SC1).

Solar science is a long, long way from being a settled science and it always amazes me that “climate science”, which is overwhelmingly dependent upon the solar dynamo in its many various forms, can be considered to be settled. And not only settled, but so little dependent upon solar effects!

We ignore the Sun at our peril!

Probability of Maunder-like minimum increases

October 28, 2013

I have been of the opinion for some time now that the current Landscheidt Minimum that we are in has a reasonable probability of reaching Dalton Minimum conditions and even developing into a Maunder-like minimum. The Landscheidt Minimum has yet to be officially named. It seems increasingly probable that we are in for some 20 – 30 years of  global cooling. This has not been the view of the global warming enthusiasts who don’t  much believe in the Sun. But now some heavy-weight opinions are also giving more credence to the possibility of a Maunder-like Minimum. We have currently reached solar maximum in Solar Cycle 24 and SC24 and the coming SC25 are comparable to SC’s 4,5 and 6 which corresponded with the Dalton Minimum. Note that the numbering system for Solar Cycles only starts after the Maunder Minimum.

Paul Hudson has been talking to Professor Mike Lockwood:

It’s known by climatologists as the ‘Little Ice Age’, a period in the 1600s when harsh winters across the UK and Europe were often severe. The severe cold went hand in hand with an exceptionally inactive sun, and was called the Maunder solar minimum. 

Now a leading scientist from Reading University has told me that the current rate of decline in solar activity is such that there’s a real risk of seeing a return of such conditions. I’ve been to see Professor Mike Lockwood to take a look at the work he has been conducting into the possible link between solar activity and climate patterns. 

According to Professor Lockwood the late 20th century was a period when the sun was unusually active and a so called ‘grand maximum’ occurred around 1985. Since then the sun has been getting quieter. By looking back at certain isotopes in ice cores, he has been able to determine how active the sun has been over thousands of years. 

Following analysis of the data, Professor Lockwood believes solar activity is now falling more rapidly than at any time in the last 10,000 years. He found 24 different occasions in the last 10,000 years when the sun was in exactly the same state as it is now – and the present decline is faster than any of those 24. Based on his findings he’s raised the risk of a new Maunder minimum from less than 10% just a few years ago to 25-30%. And a repeat of the Dalton solar minimum which occurred in the early 1800s, which also had its fair share of cold winters and poor summers, is, according to him, ‘more likely than not’ to happen. He believes that we are already beginning to see a change in our climate – witness the colder winters and poor summers of recent years – and that over the next few decades there could be a slide to a new Maunder minimum. 

It’s worth stressing that not every winter would be severe; nor would every summer be poor. But harsh winters and unsettled summers would become more frequent. 

Professor Lockwood doesn’t hold back in his description of the potential impacts such a scenario would have in the UK. He says such a change to our climate could have profound implications for energy policy and our transport infrastructure. Although the biggest impact of such solar driven change would be regional, like here in the UK and across Europe, there would be global implications too. ……… 

Recent solar activity (Wikipedia) showing the Maunder and Dalton minima

Solar Cycle 24 double peak now clearly evident

May 9, 2013

Already in March there were signs that this Solar Cycle 24 would exibit a double peak. NASA’s latest sunspot prediction for Solar Cycle 24 as of 1st May 2013 clearly shows that the sunspot activity is into its “double peak for this Cycle. A double peak was also evident in Cycles 22 and 23 and also in Cycles 5 and 14. The levels for SC24 are still going to be the lowest for 100 years and predictions for SC 25 are that they will be even lower still. Most second peaks have been somewhat smaller than the first – though not in SC5 – and seem to add around 6 months to the cycle time.

If this is indeed a double peak then I expect that solar maximum will perhaps be a few months delayed from the NASA prediction of Fall 2013. End 2013 now seems more likely.

SC24 may 2013

The Dalton minimum spanned Solar Cycles 5 and 6 from 1790 to 1820.  The Maunder Minimum from 1645 to 1715 preceded the numbering of Solar Cycles (Solar Cycle 1 started in 1755). The likelihood that SC 24 and 25 may be similar to SC 5 and 6 is growing and so is the likelihood that we will see 2  – 3 decades of global cooling. It is more likely that for the next 20- 30 years this Landscheidt Minimum will resemble the Dalton Minimum period, but if SC25 is a very small cycle then we may even approach the conditions of the Little Ice Age during the Maunder Minimum. Landscheidt’s prediction was that this minimum would last from 2000 to 2060 and the global temperature stand-still for the last 15 years gives greater credence to his forecasts.

NASA: The Sunspot Cycle —

The Maunder Minimum

Early records of sunspots indicate that the Sun went through a period of inactivity in the late 17th century. Very few sunspots were seen on the Sun from about 1645 to 1715 (38 kb JPEG image). Although the observations were not as extensive as in later years, the Sun was in fact well observed during this time and this lack of sunspots is well documented. This period of solar inactivity also corresponds to a climatic period called the “Little Ice Age” when rivers that are normally ice-free froze and snow fields remained year-round at lower altitudes. There is evidence that the Sun has had similar periods of inactivity in the more distant past. The connection between solar activity and terrestrial climate is an area of on-going research.

Does the solar cycle impact the global economic cycle?

April 2, 2013

That weather and climate are affected by solar cycles is highly likely even if it is not part of the mainstream climate theories (though I think it is patently obvious). That climate and weather affect food production is clear and that this must impact the economic cycle is not so far fetched. Yet it has never been part of mainstream economic thinking that there will be a connection from the solar cycle to global economic cycles. Back in 1801 William Herschel observed the apparent connection between the sunspot cycles and the price of wheat. Since then many economists have returned at regular intervals to studying the link between the 11 year sunspot cycle and the behaviour of the global economic cycle. It is becoming increasingly clear that the economic cycle is not unconnected with solar cycles but the mechanisms are far from clear.

Mikhail Gorbanev an economist at the IMF has a fascinating new paper that became available last month at the University of Munich. He does add this Caution though!

Caution: This research is not in the “mainstream” of the economic thought. Read at your own risk!

Sunspots, unemployment, and recessions, or Can the solar activity cycle shape the business cycle?,” MPRA Paper 40271, University Library of Munich, Germany. (pdf Gorbanev Business Cycle and solar cycles MPRA_paper_40271)

Gorbanev shows some interesting correlations and  goes on to predict that “For other advanced economies, the upcoming solar maximum also suggests higher chances of recessions. The 3-year period when the recessions are most likely to occur in the G7 countries would run from early 2013 till end-2015”.

Whether there will be a sharp increase in US unemployment after the solar maximum remains to be seen. But it is not so unlikely that the world economy has another 2 – 3 tough years ahead!


Sunspot cycles and US unemployment (Gorbanev 2012)

Sunspot cycles and US unemployment (Gorbanev 2012)

Abstract 

 Over the last 77 years (from 1935), all 7 cyclical maximums of the solar activity overlapped closely with the US recessions, thus predicting (or triggering?) 8 out of 13 recessions officially identified by NBER (including one “double-deep” recession). Over the last 64 years (from 1948), all 6 maximums of the solar activity were preceded by minimums of the US unemployment rate, and the spikes in the unemployment rate followed with lags of 2-3 years. On the world scale, over the last 44 years (for which the data is available), all 4 maximums of the solar activity overlapped with minimums of the unemployment rate in the G7 countries, followed by its spikes within 2-3 years. From 1965, when consistent recession dating is available for all G7 countries, nearly 3/5 of the recessions started in the 3 years around and after the sunspot maximums. Was it a mere coincidence or a part of a broader pattern? This paper explores the correlation between the solar activity cycles (as measured by the number of sunspots on the sun surface) and the timing of recessions in the US and other economies. It finds out that the probability of recessions in G7 countries greatly increased around and after the solar maximums, suggesting that they can cause deterioration in business conditions and trigger recessions. This opens new approach for projecting recessions, which can be applied and tested with regard to the next solar maximum in 2013.

We learn about climate only when the models are wrong!

March 29, 2013

When a forecast based on a mathematical model is correct, we learn nothing.

A mathematical model is merely a theory, a simplification of reality or an approximation to the real world. By definition a mathematical model is a hypothesis.  When forecasts are incorrect, we can return to our model and improve it and make a new hypothesis. A forecast is then a test of the model but in just one particular set of circumstances. Being correct does not prove the theory behind the model. It does of course add to the body of evidence that the model may be a satisfactory representation of reality and it does allow further forecasts to be made without tweaking the model. For learning to take place the mathematical model must be the falsifiable hypothesis of the scientific method.

It seems to me that Solar Science has a much healthier (scientifically) attitude to models and forecasts than “Climate Science”. When observations don’t match a climate forecast, the observations are impugned rather than the models being improved. This is, I think, because the forecast climate results have been used to establish huge revenue flows in the political arena (whether as taxes or carbon credits or just as research funding). There has been a vested interest in denying the observations and calling the science “settled”. Once the science is “settled”  the climate forecast and its underlying model become sacrosanct and take on the certainty of prophecy. Instead of being falsifiable hypotheses, climate model forecasts have taken on the character of unfalsifiable prophecies!

No scientist would presume to claim that we know or understand all solar effects. Or that we know and understand the role of the oceans or of the water vapour and dust and aerosols in the atmosphere. “Climate” is contained in the thin, chaotic layer of atmosphere which surrounds us. Yet “Climate Science” makes the arrogant assumption that the effect of trace amounts of carbon dioxide on climate is known definitively. Filling a real greenhouse with higher concentrations of carbon dioxide does not make that greenhouse any warmer than one filled with normal air – but the plants do grow faster with access to the additional CO2!! But – claim the climate priesthood –  in the real atmosphere, carbon dioxide causes other forcings (clouds? aerosols? precipitation effects?) which maximise warming which means that our model is still valid. Why not just admit that we don’t know what we don’t know?

The behavioural issue of course is whether it is worth trying to control something as poorly understood as climate rather than ensuring that we have the wherewithal to adapt to whatever changes may come. Another ice age will surely come whether in 10 years or a 100 years or 2,000. It will then be our ability to harness all available energy sources around us which will determine our capacity to adapt.

Learning from forecasts when they are wrong – not just in science but also in business and project management and technology development – has long been a hobby-horse of mine and is why forecasts need to be wrong.

When there is no difference there is no learning.

  • I take prophecies to be a promise about the future  based primarily on faith and made by prophets , witchdoctors, soothsayers and politicians such as ”You will be doomed to eternal damnation if you don’t do as I say”,
  • I take “forecasts” to be an estimate of future conditions based on known data with the use of calculations, logic, judgement, some intuition and even some faith. They are extrapolations of historical conditions to anticipate – and thereby plan for -future conditions.

……. Over the last 30 years I have spent of a lot of time conducting and participating in reviews. Reviews of research projects, of construction projects, of organisations and processes, of designs, of strategies and action plans, of businesses and of companies. The common features  in all these different reviews, that I have found the most penetrating, have been the comparisons not only between forecast values  and actual values, (which may be any values indicating performance and capable of being extrapolated), but also between past forecasts and current forecasts.

Whether considering construction progress or costs or sales figures or cash flow or profit or number of patents applied for, it is the differences between forecast and actual values, or values forecast before and values forecast later which have led to learning. In all these fields we are in the area of the behaviour of complex systems; and where people and their behaviour is involved any system is inevitably a complex system.

When a forecast is fulfilled there is usually an air of congratulation, satisfaction and self-adulation and this leads to a deadly complacency that everything is “settled science” and well understood. In any enterprise of any kind, that kind of complacency is the kiss of death. It is the differences which lead to questioning, to proper scientific scepticism, to further investigation and ultimately to an increase of understanding and – perhaps – a better forecast. (Of course, ignoring all such differences  and to merely “continue as before” can be equally fatal).

Which brings me to climate (which is not a science by any stretch of the imagination) and solar cycles. They are both in the realm not only of where “what we know is a great deal less than what we don’t know” but they are also both in the region where “we don’t even know what we don’t know”. We do not even know all the questions to be asked. They are both complex systems where – by definition – the complexity lies in the multitude of the processes involved and their interactions.

When climate – which is contained in the 100 m of ocean and 20 or so km thick, turbulent and chaotic atmospheric layer (and which is dimensionally miniscule in relation to the 140 million km of the earth-to-sun system) – is so complacently considered to be “settled science” then we have shifted into the area of faith and soothsaying and prophecies. When climate modellers are smug enough to believe they have understood the climate system and believe that their models are complete, then the models produce outputs which are not forecasts but prophecies. (No doubt soothsayers and shamans have sometimes made accurate prophecies but I still would not buy a used car from one of them)! Weather is in the realm of forecast (though you could argue that the most accurate forecast is still that “the weather tomorrow will be like today”) but climate is not yet there.

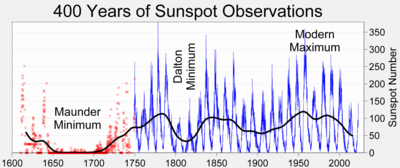
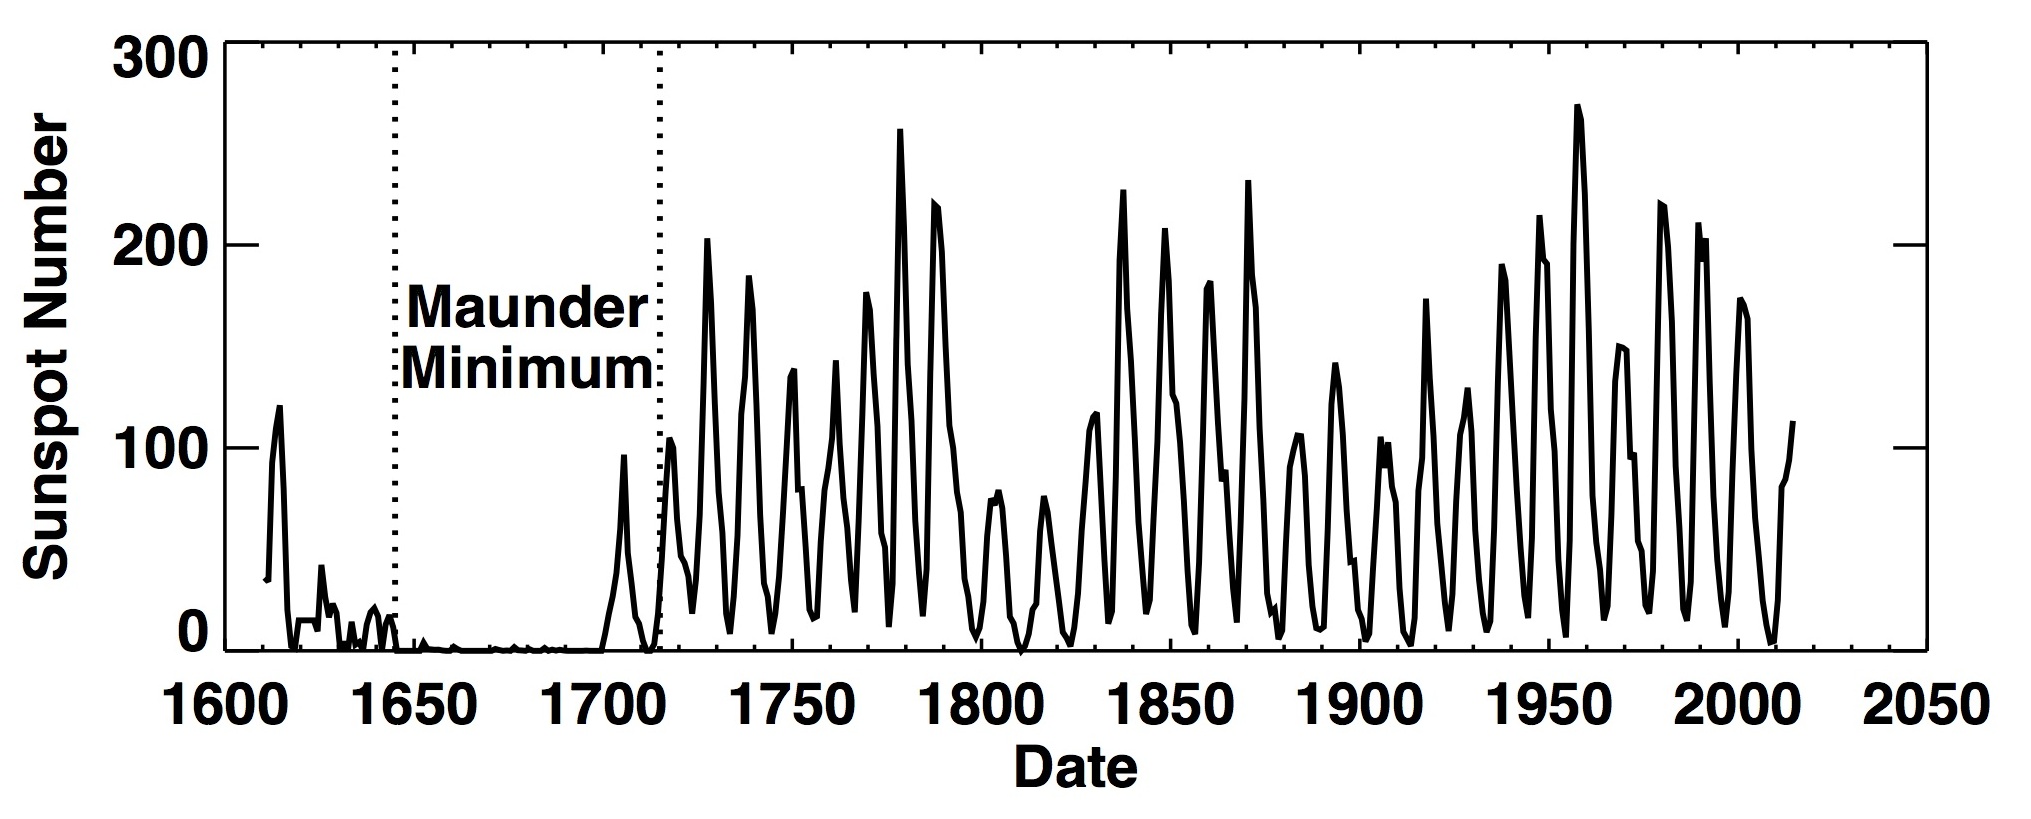
This kind of “arrogance” which pervades some of the climate “scientists” is not so prevalent when it comes to the study of Solar Cycles. There is a clear understanding that “we don’t know what we don’t know”. In addition to the 11 year and 22 year cycles, other cycles are hypothesised for 87 years, 210 years, 2300 years (or maybe 2241 or 2500 years) and 6000 years. We have no idea what causes these cycles. Even the 11 year cycle which has been most studied produces  surprises every day but is properly in the area of “forecast” (and hopefully never again will be in the area of prophecy). ….

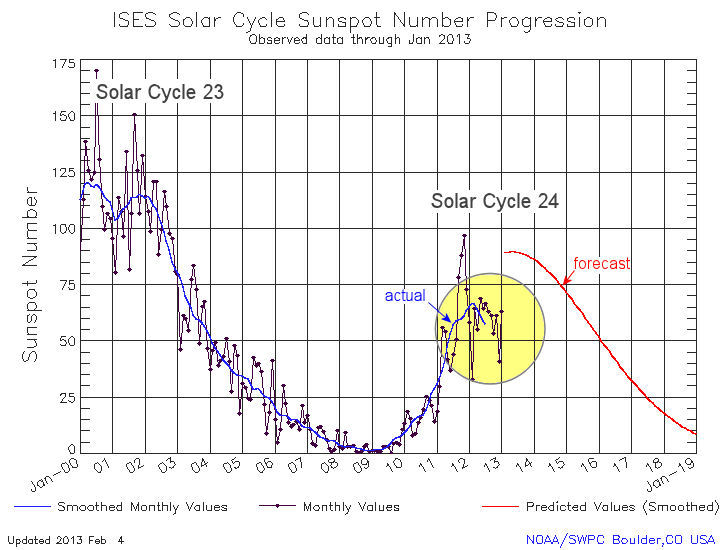
…… We seem to be in a solar minimum. We may be seeing a 210 year cycle – or maybe not. There are changes to the forecasts not only regarding the maximum level of sunspot activity but also about when it will occur and what the length of cycle 24 might be. There is speculation as to what effect the length of the solar cycle may have on climate – but we haven’t a clue as to what mechanisms may be involved.  This is not to say that there isn’t much speculation and hypothesising. There is a great deal of comment about the effect these changing forecasts may have on global warming or cooling or climate disruption.  In some quarters there is much glee that the forecasts have been “wrong”. Some comments question the intelligence of the forecasters.

But of course the forecasts themselves say nothing about how the behaviour of the sun may impact our climate. They do not pretend to be prophecies or to be statements of inevitable outcomes. All they do say is that we don’t know very much – yet – about the sun. But we do know enough to make some tentative forecasts.

But I am very glad that people continue to be brave enough to make forecasts and I am quite relieved that the forecasts are not spot on. That at least ensures we will continue learning.

Double peak in Solar Cycle 24? as in SC14 and in SC5?

March 4, 2013

The NOAA/NASA Solar Cycle Prediction Panel is puzzled. They don’t know if we are reaching solar maximum or whether another little peak could be on its way which would shift solar maximum for SC24 to 2014 from 2013.

And should we compare SC24 with SC14 or should it be SC5?

But SC24 will still show the lowest sunspot activity for 100 years. I note that not only SC14 but even SC5 had a double peak – so my expectation remains that this Landscheidt Minimum may be comparable to the Dalton Minimum – though not perhaps to the Maunder Minimum.

credit Dr. Tony Phillips

credit Dr. Tony Phillips

This Sciencecast video is a good summary of what we don’t know:

Landscheidt’s prediction is that this Minimum will last till 2060 so we can expect low sunspot activity for the next 4 sunspot cycles (till SC28).

Landscheidt’s predicted solar minima

The Sc24 –  SC5 comparison looks like a repeating pattern but it would be wrong to assume that the Sun cares about this and it will surely continue to keep us perplexed as it does its own thing.

SC24 compared to SC5

The Big Picture is persuasive – even if we don’t really know what the sun is upto and even less about how the Earth dances to the Sun’s music.

Recent solar activity (Wikipedia) showing the Maunder and Dalton minima

Related:

Solar cycles and the Landscheidt minimum

Theodor landscheidt: Sun-Earth-Man and the Kepler ratios

Solar Cycle 24 prediction: On track to be smallest in 100 years

June 12, 2012

NASA has updated its forecast for Solar Cycle 24.

Maximum is expected to be reached in Spring 2013 with a sunspot number of 60 and this prediction is for the lowest sunspot number in  100 years. This only confirms that we are currently in a solar minimum – the Landscheidt Minimum – though it remains to be seen whether this will be a Grand Minimum in the style of the Maunder Minimum or the Dalton Minimum. In any event a period of several decades of global cooling is to be expected and is already probably upon us (starting some 10 years ago).

(more…)

Solar Cycle 24 NASA forecast update

March 13, 2012

David Hathaway has a new forecast for solar cycle 24:

The current prediction for Sunspot Cycle 24 gives a smoothed sunspot number maximum of about 59 in early 2013. We are currently over three years into Cycle 24. The current predicted size makes this the smallest sunspot cycle in about 100 years.

SC24 forecast: updated 2nd March 2012

SC25 will likely be even smaller and it now remains to be seen if this Landscheidt Minimum is closer to a Dalton Minimum or a Maunder Minimum.

(more…)


%d bloggers like this: