“Dad, What’s inflation? Why are Sweden and the UK trying to increase inflation and why are India and China trying to reduce it? Is inflation good or bad?”
Well, it all starts with the economic cycle and the resistances in …….
“What’s an economic cycle?”
OK. Let’s start at the beginning.
Let’s start at the very beginning
a very good place to start
when you read you begin with abc
An economy begins with “N”, “P”, “C”
“N”, “P”, “C”
the three legs needed just happen to be
“N”, “P”, “C”; “N”, “P”, “C”
When you get hungry you have a Need, a need for food. That’s where all economies start – with a need, the “N”. So you shout “Mom, What’s for dinner? I’m starving”. It’s fortunate that Mom is there and responds to your shout and starts Producing some dinner. Thats the “P”. And after some time you get your dinner and you Consume it. That makes you a consumer. And then when you’re ready to go out to your party you shout “Dad, can you drop me off at Jimmy’s (and pick me up later)?” you are just another Consumer expressing another Need – a need this time for transport. And when I take you there and bring you back, I am the Producer. And when you come home you’re hungry again. This is the basic cycle – Needs lead to Production which in turn leads to Consumption which leads to new Needs.
A production-consumption loop provides a business process.
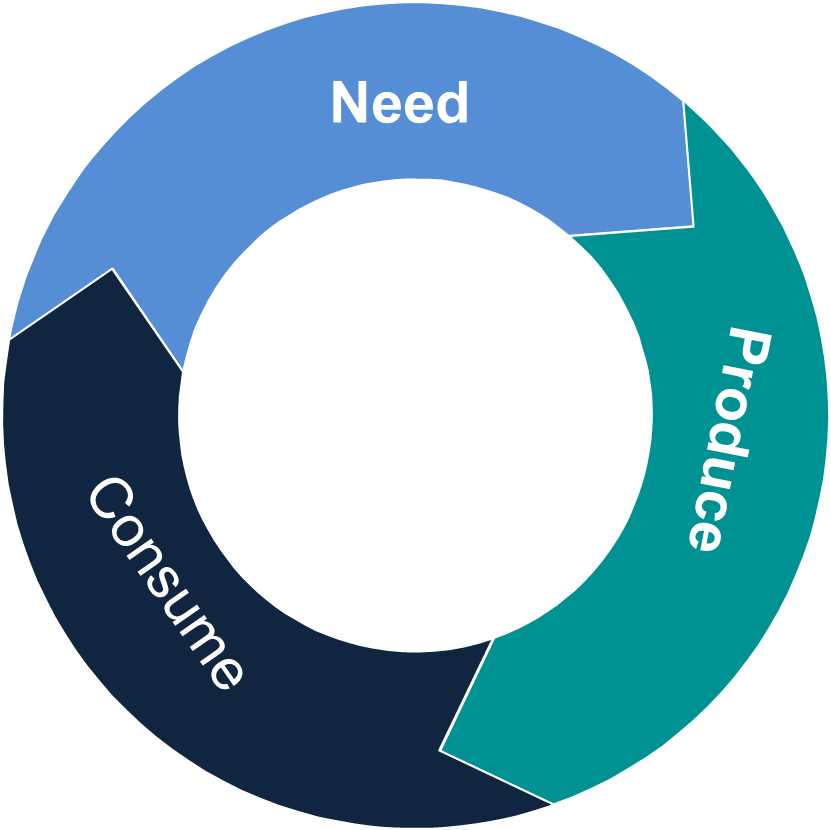
The fundamental economic cycle
Every human is a consumer. All producers are consumers. But not all consumers are producers. The economic cycle is the cycle of living. And the more complex the society, the more complex and interconnected are all the various business processes that go to making up the economic cycle. Much of the production may be indirect or the production is of abstract things. Teachers produce “education”. Policemen produce “safety”. Actors and sports stars produce “entertainment”. It can be difficult to discern what politicians and priests produce but they too satisfy human needs. Even you produce something – mainly tension and stress which we consume for the goodness of our souls.
But time is the necessary additional dimension. All these various processes take time. It takes time for a new need to entice a producer and it takes time for the production and then it takes time to get to the point of consumption. The economic cycle is not just a circle. It is a continuous circle wrapped around the time axis. With time involved, the economic cycle reflects “motion” – a movement in time. And wherever there is motion there is resistance to motion. Each part of the cycle and of its subcycles is subject to inertia and friction. Inertia is the resistance not only to the start of motion but also to a change in an existing motion. It comes into play whenever a new need or a changed need requires some new production process or a change to a production process. And once the motion is in progress – and this applies to every business process and to every interaction between processes – there is a frictional resistance to the motion. Inertial resistance is generally higher than rolling friction.
And so we come to inflation. You can think of inflation as a measure of the resistances (inertial and frictional) to motion within an economic cycle. For any business process it can never be zero except if motion stops. When an economic cycle is said to have a negative inflation or a deflation, it only means that some of the component business processes are coming to a halt. For a well functioning economy, the resistances will be as low as possible and that represents the “healthy” level of inflation for that economy. When inflation is said to be very high it means that business processes are operating sub-optimally – maybe in a stop-go manner, or that they are not meshing together very well or that there is turbulence in the work place.
So when the UK and Sweden try to bring their inflation rate up to about 2%, it is because 2% is judged to be representative of the resistance if all parts of the economy are functioning as smoothly as possible and growing modestly. When India tries to bring its inflation down from double digits to about 4% as a target, it means that many component parts of their economic cycle are functioning – or not – with too high a level of resistance. Processes are starting and stopping or are very inefficient – within themselves or that their inter-connections are broken or damaged.
In a rapidly growing economy where there are inertial resistances to overcome, the “healthy” level will have to be greater than the assumed 2% norm.
So, inflation is neither bad or good – it is a consequence of the business processes making up the economic cycle. It is measure of resistance to the motion of business processes. Even when operating smoothly these processes are subject to frictional resistance. Any growth of the cycle itself requires that production processes start or change and that brings in inertial resistance in addition to the frictional resistance. So inflation can never be zero but for every economic cycle, it needs to be as low as possible for a given complexity, a given size and a given growth. A too low inflation means that some of the component business processes are shrinking or coming to a halt. A too high level of inflation in an economy indicates that resistances are much too high and that the component business processes are not functioning as they should.
In developed countries of Europe the target inflation is at about 2% whereas in faster growing economies (China or India) the target is to be at around 4%.
It’s just a simple matter of “N”, “P”, “C”.
Got it?
“Duh!
With the resistances in this house, my pocket money needs to go up by 20% – at least!”