Archive for the ‘Geosciences’ Category

Ozone layer hits record thickness in Sweden: Was there ever an ozone hole problem?

January 9, 2011

Lately there has been an increasing view that some of the catastrophe scenarios about the ozone hole which led to the Montreal Protocol of 1989 were exagerrated and based on poor science. The effects of humans on ozone variations as opposed to natural variations may have been exaggerated. In fact there are now some suggestions that the actions taken were not only unnecessary but that they have not had much to do with the natural increase of ozone layer thickness observed in recent times.

The Local reports:

Sweden’s government weather agency reported on Friday that the ozone layer over southern Sweden reached its thickest levels at the end of last year, surpassing the previous record set in 1991.

Sweden’s Meteorological and Hydrological Institute (Sveriges Meteorologiska och Hydrologiska Institut, SMHI) explained that the weather was particularly favourable at the end of 2010 and it explain why the ozone layer was especially thick at the time. “It is a step in the right direction, but it is still too early to say that the ozone layer has recovered. The favourable weather situation over the last few months has contributed to a record high,” said Weine Josefsson, a meteorologist at SMHI, in a statement on Friday.
The annual value of the ozone layer’s thickness over Norrköping in 2010 stood at a new high of 351.7 Dobson units (DU). The previous record was set in 1991 at 341.8 DU. The November and December values in particular set new records among the measurements regularly made at SMHI since 1988. ……….  Even in Norrland in the country’s north, the values have been positive in the last year. The ozone layer has been measured regularly in Vindeln northwest of Umeå in northern Sweden since 1991 and the latest results were also positive in this area.
However, it is not possible to record complete ozone measurements in the winter, so it is uncertain whether a record was set there as well at the end of last year. In November and December, air flows were affected by a special weather situation over western Europe, resulting in an extra thick ozone layer over this part of the world in these two months.
It is possible that the restrictions on ozone-depleting substances proposed in the Montreal Protocol in 1987 have also contributed to the thickening of the ozone layer. However, this type of measure is effective over a long period of time and it is difficult to distinguish the effect of natural variations in this case.

New pictures show the return of Jupiter’s lost stripe

November 26, 2010

In May this year one of Jupiter’s characteristic stripes (the South Equatorial Belt) disappeared. Then  two weeks ago a turbulent plume was observed breaking through the giant planet’s cloudtops in the south equatorial zone heralding the possible re-emergence of the stripe.

Now the latest infrared pictures of Jupiter show the turbulent plume developing into a “trail” suggesting that the SEB is re-emerging from under the ammonia clouds. The BBC reports:

Jupiter's returning stripe highlighted (JPL, University of Oxford, UC Berkeley, Gemini Observatory, University of San Carlos)

Jupiter's returning stripe highlighted (JPL, University of Oxford, UC Berkeley, Gemini Observatory, University of San Carlos)

The South Equatorial Belt had blended into surrounding white clouds but an “outbreak” spotted by an amateur astronomer heralds the stripe’s return. The stripe’s disappearing act is due to clouds shifting altitudes, with white ammonia clouds obscuring clouds below. This performance will give astronomers their first chance to study the weather and chemistry behind the phenomenon.

As part of the show, the Great Red Spot has darkened, but astronomers say it will lighten again as the South Equatorial Belt comes back. The stripe has come and gone several times in recent decades but the mechanism by which it returns remains mysterious. The first signs of the return were spotted by Christopher Go of the Philippines and was confirmed by the Infrared Telescope Facility and Gemini and Keck telescopes in Hawaii.

“At infrared wavelengths, images in reflected sunlight show that the spot is a tremendously energetic ‘outburst,’ a vigorous storm that reaches extreme high altitudes,” said Imke de Pater, professor of astronomy at the University of California, Berkeley. “The storms are surrounded by darker areas, bluish-grey in the visible, indicative of ‘clearings’ in the cloud deck.”

Lowest November temperature since 1995, negative NAO drives frigid polar air over Sweden

November 25, 2010

Last night the temperature in Northern Sweden dropped to -37 Celsius, the coldest temperature recorded for a November day since 1995.

Bitter winter on the way: expert

24th November 2010 - Photo Fredrik Sandberg / Scanpix


“This year’s winter can be just as cold and snowy as last year. Now, as then, there is a weather phenomenon that causes cold air from the polar regions to plummet over us”,

writes the Svenska Dagbladet

The North Atlantic Oscillation is in a negative phase (NAO-).Before last year’s winter this had not occurred in years. The default mode instead was of the NAO  in a positive phase with the warm southwest winds, which resulted in mild, almost snow-free winters in northern Europe.

“Now it looks like last winter. If it continues, it means bitter cold. But you never know when the weather turns, “said meteorologist and researcher Per Kållberg at SMHI to Sydsvenskan. Meteorologists around the world are now discussing if the negative phase will continue. It started in December 2009 and has persisted since then, which is the longest period in over 40 years. Nikkaluokta in northern Lapland had  minus 36.6 degrees yesterday – the season’s lowest temperature so far, according to SMHI. It is also the lowest November temperature in Sweden since 1995.

The bitterly cold and long winter last year followed by the early start to this winter is, of course,  only weather – not climate.

But I expect in Cancun next week all the “believers” will be chanting their mantra of 2010 being a very warm year. Common sense will be notably absent of course.


Mount Merapi winds down and Indonesia plans ending of Emergency period

November 19, 2010

The Indonesian news agency ANTARA reports that:

The government is to end the emergency response period for the Mount Merapi eruption disaster on November 24, a cabinet member said.

“We will maintain the emergency response period until November 24. Whether the period will be extended or not will depend on the situation,” Social Welfare Minister Salim Segaf Al-Jufri said.
Speaking to newsmen on when visiting Magelang district on Thursday, he said Mt Merapi evacuees could return home after the volcano`s “beware” status had been lowered.

After the end of the emergency response period, the National Disaster Management Agency (BNPB) would begin implementing the reconstruction and rehabilitation programs for Mt Merapi victims, he said. “Houses that have been damaged or destroyed will be rebuilt and people who have lost cattle will be financially compensated. The funds to pay for people`s dead cows would be taken from the state and regional government budgets”, he said.
Salim Segaf Al-Jufri further said his ministry had at its disposal Rp397 billion in funds to help disaster victims. Eighty percent of the amount was to meet the victims` physical needs and the rest for operational expenses. But there also was more than Rp3 trillion in stand-by funds to respond to the needs of reconstruction and rehabilitation, he added.
Mount Merapi had erupted repeatedly in the past two or three weeks but its most fatal eruptions occurred on October 26 and November 5. As a result of the eruptions, at least 259 people had perished and many others sustained burns and became displaced.
Topographischer Atlas zur Reise durch Java: Magdeburg, Verlag E. Baensch 1845
via wikipedia.de.
Merapi from the South
File:Merapi-Suedseite.jpg

Jupiter’s lost stripe may be returning

November 16, 2010

In May this year, one of Jupiter’s characteristic stripes – the South Equatorial Belt (SEB) disappeared.

http://science.nasa.gov/science-news/science-at-nasa/2010/20may_loststripe/

May 20, 2010: In a development that has transformed the appearance of the solar system’s largest planet, one of Jupiter’s two main cloud belts has completely disappeared. Known as the South Equatorial Belt (SEB), the brown cloudy band is twice as wide as Earth and more than twenty times as long. The loss of such an enormous “stripe” can be seen with ease halfway across the solar system.

These side by side images of Jupiter taken by Australian astrophotographer Anthony Wesley show the SEB in August 2009, but not in May 2010.Individual images: Aug. 4, 2009; May 8, 2010.

Anthony Wesley is a veteran observer of Jupiter, famous for his discovery of a comet hitting the planet in 2009. Like many other astronomers, he noticed the belt fading late last year, “but I certainly didn’t expect to see it completely disappear,” he says. “Jupiter continues to surprise.” Planetary scientist Glenn Orton of NASA’s Jet Propulsion Lab thinks the belt is not actually gone, but may be just hiding underneath some higher clouds.

“It’s possible,” he hypothesizes, “that some ‘ammonia cirrus’ has formed on top of the SEB, hiding the SEB from view.” On Earth, white wispy cirrus clouds are made of ice crystals. On Jupiter, the same sort of clouds can form, but the crystals are made of ammonia (NH3) instead of water (H2O).

But now the SEB may be breaking through again.

http://www.spaceweather.com/

Tuesday, Nov. 16, 2010: A turbulent plume is breaking through the giant planet’s cloudtops in the south equatorial zone, heralding the emergence of … what? This Nov. 14th photo from astrophotographer Paul Haese of Glenalta, South Australia shows the plume.

The SEB revival is now underway. Tonight I captured the revival transiting the face of Jupiter. To boot I was lucky enough to include Ganymede with detail and Europa's shadow after a double transit. What a night. Taken with peltier cooled C14 and Skynyx 2-0: Paul Haese

The plume, circled in Haese’s photo and known to astronomers as the “SEB Revival Spot,” is a sign that Jupiter’s South Equatorial Belt (SEB) is about to return. The great brown belt disappeared earlier this year, leaving Jupiter without one of its signature stripes. No one knows where the SEB went, although some researchers have speculated that it sank beneath high altitude clouds and might now be bobbing back to the top.

Christopher Go of the Philippines first noticed the Revival Spot on Nov. 9th. At first it was small and white and required careful astrophotography to detect. Only five days later, it is expanding rapidly and darkening; soon, it could become visible to novices in the eyepieces of backyard telescopes.

Water levels in the Murray-Darling basin are highest since 2001

November 14, 2010
Second version of a Murray catchment map

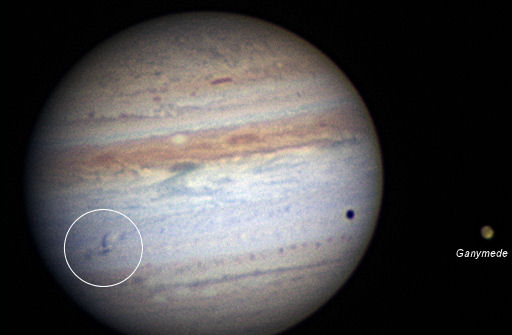
Murray Darling Basin: image via Wikipedia

After 10 years of drought, heavy rainfall has left the Murray-Darling Basin now so full of water that controlled spillages are having to be made to prevent levels becoming too high. The Sydney Morning Herald:

AFTER years of drought, there are dams and reservoirs across the Murray-Darling Basin where controlled spilling is taking place to keep levels within specified limits. The amount of water stored in the basin is close to 19,000 gigalitres, the highest level since November 2001. The Bureau of Meteorology water storage website, which monitors more than 25,000 gigalitres of storage, reports that basin storages are now more than 74 per cent full, compared to 29 per cent a year earlier.

Several reservoirs have reached capacity, including the Menindee Lakes, Burrendong Dam and Blowering Reservoir in NSW, and the Hume Dam on the NSW-Victoria border near Albury. A year ago the Hume Dam was at 39 per cent and the Blowering Reservoir at 36 per cent.

A spokeswoman for the Murray-Darling Basin Authority confirmed it had been forced to spill water from the Hume Dam and Lake Menindee to prevent the storages rising above specified levels. More rain is forecast for the Murray-Darling Basin tomorrow and on Monday, but the bureau’s deputy director for water, Robert Vertessy, said it was ”50/50” whether storages would break through the 75 per cent mark because a lot of the rain was expected to fall in areas that have no further capacity.

”What is spectacular is how much it has gone up in the last year,” Dr Vertessey said. In the long term it was very unlikely that basin storages would ever reach 100 per cent because rainfall patterns varied across the basin and some dams, such as the Dartmouth in north-eastern Victoria, had enormous capacity compared to the drainage area they serviced, Dr Vertessey said.

Replenished water storages mean that many farmers are now receiving their full general allocation of water. Trading of temporary water allocations has ground to a halt in many areas and the price of water in one exchange has fallen to $45 per megalitre, down from $200 a year ago and a peak of about $1200 in late 2007.

Meanwhile the Guide prepared by The Murray-Darling Basin Authority came under fire because the computer models used to prepare the Guide did not (or could not) account for some 20% of the water flows in the basin. The Guide has proposed drastic cuts in irrigation flows and this not at all popular with farmers. The Australian reports:

KEY assumptions about water flows in the Murray-Darling Basin guide are under challenge from newly released figures. It emerged that 20 per cent of basin water flows were not included in scientific models. The models were used to recommend cuts of up to 37 per cent in irrigators’ water entitlements.

In technical volumes published with the guide, the Murray-Darling Basin Authority said the complexity of hydrologic modelling made it difficult to consider a large range of scenarios on sustainable diversion limits in a timely way. Hydrologic models have been developed for all major rivers in the basin in conjunction with the states and the CSIRO. “Overall, about 80 per cent of current surface water use under current diversion limits in the basin is explicitly represented in the hydrologic modelling framework,” the guide says.

The National Farmers Federation seized on the concession, saying it would challenge key assumptions in the guide. NFF chief executive Ben Fargher said he would challenge how the plan had identified environmental assets for protection and the modelling for environmental water requirements. “They are saying because of the complexity of all the hydrological models it has been difficult for them to do the modelling, and so they’ve used analytical tools,” he said. “We are not confident in that. In our view it is not robust, not good enough and we are going to challenge it.” NSW Irrigators Council chief executive Andrew Gregson said the guide’s modelling “has holes in it” and the authority needed to be 100 per cent certain, given the enormous ramifications for the communities along the river.

Last night the authority defended the guide and Wentworth Group of Concerned Scientists chief executive Peter Cosier described the science behind it as “some of the best in the world”. The authority said the 20 per cent of water flows not represented in hydrologic models would not affect recommendations about water allocations or environmental flows.

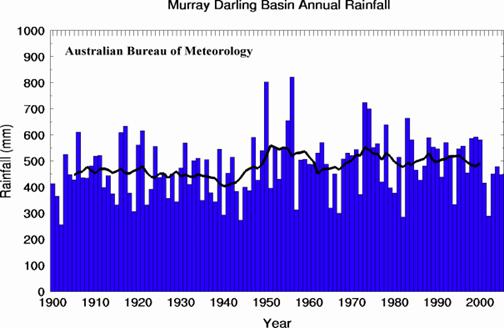
The 10 years of drought have often been attributed to climate change but rainfall records over the last 100 years  suggest that the variation of rainfall and of the subsequent water levels are nothing unusual. Online opinion has this to say:

The Australian Bureau of Meteorology has information on rainfall right back to 1900. The rainfall record for the Murray Darling Basin (see chart below) shows there have been periods of as low rainfall in the past. The 11-year rolling average, the trend line shown in chart, indicates there has been no general increase or decrease in rainfall over the last 100 years. Carbon dioxide levels have increased by about 30 per cent over this same period.

Indeed the rainfall record for the Murray Darling Basin would suggest it is drawing a long bow to blame the current drought on climate change.

Murray Darling Basin Annual Rainfall

The DC3 lives on

November 12, 2010

Translated freely from Ny Teknik:

When  German polar researchers needed to acquire a further research plane,  they selected the Basler BT-67, a newly built version of the classic DC3.

The Basler BT-67 fitted with skis: image Ny Teknik

The Alfred Wegener Institute for Polar and Marine Research needed to supplement its fleet of aircraft that can fly over the Arctic and Antarctic. They already had good experience with their Polar 5 and have now ordered another, Polar 6, to perform measurements simultaneously over the two poles.

The plane chosen is a Basler BT-67, basically a modern version of the classic DC3 built today by Basler Turbo Conversions of Oshkosh, Wisconsin, USA.
Compared with a classic DC3 the Basler is 40 inches longer, has 35 percent more volume, can load 43 percent more cargo, is 24 percent faster and carries twice as much fuel.
Instead of reciprocating engines in the original DC3 the Basler is equipped with turboprop engines from Pratt & Whitney.
Warren Basler, who founded the company, thought it was a pity that such a sound design as the DC3 would not live on. The company has been making planes since 1990.

From Wikipedia:

The Basler BT-67 is a conversion of the DC-3. Basler refurbishes DC-3s at Oshkosh, Wisconsin, fitting them with Pratt & Whitney Canada PT6A-67R turboprop engines, lengthening the fuselage by 40 in (100 cm) with a fuselage plug ahead of the wing and strengthening the airframe in selected areas. The airframe is rated as having “zero accumulated fatigue damage.” This and extensive modifications to various systems and avionics result in a practically brand-new aircraft. The BT-67s have been supplied to civil and military customers in several countries.

The 75th Anniversary of the DC-3’s first flight will be on December 17, 2010.

The Classic DC3 has been flying since 1935: image http://www.wmof.com

Mount Merapi eruption images from Nasa

November 11, 2010

The steep-sided, cone-shaped Mount Merapi volcano is both boon and curse to the people of Indonesia. Volcanic ash from its frequent eruptions makes the soil fertile enough to support a large population. It is also one of Indonesia’s most active volcanoes, posing a constant threat to tens of thousands of people who live in its shadow. On October 26, 2010, the volcano once again turned destructive, unleashing a series of eruptions that had killed at least 44 people and forced 75,000 people from their homes, said CNN on November 4.

Eruption at Mount Merapi, Indonesia

Eruption at Mount Merapi, Indonesia: Nov 1st: image NASA


The mountain has been shrouded in clouds throughout the eruption, but on October 30 the Advanced Spaceborne Thermal Emission and Reflection Radiometer (ASTER) on NASA’s Terra satellite captured the thermal signature of hot ash and rock and a glowing lava dome. The thermal data is overlaid on a three-dimensional map of the volcano to show the approximate location of the flow. The three-dimensional data is from a global topographic model created using ASTER stereo observations.

The Center of Volcanology and Geological Hazard Mitigation reported that two pyroclastic flows moved down the volcano on October 30. A pyroclastic flow is an avalanche of extremely hot gas, ash, and rock that tears down the side of a volcano at high speeds. ASTER imaged one of those flows.

Merapi shows no signs of slowing. After several days of eruptive episodes, the volcano began an eruption on November 3 that was five times more intense than on October 26 and lasted more than 24 hours. It is the most violent eruption at the volcano since the 1870s, said local geologists.

See more NASA images at:

http://earthobservatory.nasa.gov/NaturalHazards/event.php?id=46815

Eruption at Mount Merapi, Indonesia

SO2 cloud from Mt. Merapi: 4th November: image NASA

Eruption at Mount Merapi, Indonesia

Ash plume from Mt. Merapi 8th Nov: image NASA


Borobodur Temple covered by Merapi volcano ash

November 7, 2010


Borobudur temple view from northeast plateau, ...

Borobudur Temple: Image via Wikipedia


Update from CNN:

The death toll from recent eruptions at Indonesia’s Mount Merapi continues to rise as the volcano spewed hot ash clouds and gas on Sunday. At least 156 people have died since Merapi started erupting on October 26. Ash columns reached as high as 6 kilometers (3.7 miles), according to the Indonesian Volcanology and Geological Disaster Mitigation Agency.

The Borobudur temple lies about 45 km from Mount Merapi and is currently covered with ash which is being painstakingly cleared.

Employees of Borobudur temple on Sunday were working to keep the historic site from being damaged by the thick black ash that has fallen from nearby Mount Merapi’s eruption.

Karyono, a parking lot employee who has been working there since 1986, was taking the ash off the driveway and the parking lot. Using a small iron shovel, he and his 10 coworkers were squatting and painstakingly taking the ash away in buckets.Karyono said that he has been cleaning since Saturday and piling up the ashes to be dumped elsewhere.

While the cleanup operation continues, the famous temple is closed to visitors from Nov. 5 to 9.

Mount Merapi unleashed nearly 50 million cubic meters of gas, rocks and ash on Friday, its most powerful eruption in a century.

Up to 138 people have now died on Merapi’s slopes in the past ten days of eruptions and gas cloud ash emissions.

Authorities charged with conserving the temple say that

ash up to 3-centimetres deep has covered it and the acidity could erode the temple’s stones. They believe that if the ash it is not cleared away quickly it will accelerate the decay of the stones. The monument comprises six square platforms topped by three circular platforms, and is decorated with 2,672 relief panels and 504 Buddha statues. A main dome, located at the center of the top platform, is surrounded by 72 Buddha statues seated inside perforated stupa. The monument is both a shrine to the Lord Buddha and a place for Buddhist pilgrimage. The journey for pilgrims begins at the base of the monument and follows a path circumambulating the monument while ascending to the top through the three levels of Buddhist cosmology, namely Kāmadhātu (the world of desire), Rupadhatu (the world of forms) and Arupadhatu (the world of formlessness). During the journey the monument guides the pilgrims through a system of stairways and corridors with 1,460 narrative relief panels on the wall and the balustrades. Officials however confirm that over the next few days they will be conducting a technical evaluation for the cleaning process. The temple was again closed down for visitors temporarily after volcanic ash covered it following the Merapi volcano’s powerful eruptions on Friday. When the cleanup is completed visitors will be allowed to visit the site early next week – but they will still not be permitted to climb up to the temple.

Evidence suggests Borobudur was abandoned following the 14th-century decline of Buddhist and Hindu kingdoms in Java, and the Javanese conversion to Islam. Worldwide knowledge of its existence was sparked in 1814 by Sir Thomas Stamford Raffles, then the British ruler of Java, who was advised of its location by native Indonesians. Borobudur has since been preserved through several restorations. The largest restoration project was undertaken between 1975 and 1982 by the Indonesian government and UNESCO, following which the monument was listed as a UNESCO World Heritage Site. It is still used for pilgrimage; once a year Buddhists in Indonesia celebrate Vesak at the monument. Borobudur remains Indonesia’s single most visited tourist attraction.

Since Borobudur was built sometime in the 9th Century it has probably seen – and survived – over one hundred eruptions from Mount Merapi in the following 1200 years. Mount Merapi is Indonesia’s most active volcano and has certainly been erupting regularly at least since 8000 BC. Since 1548 written eruption records are available but earlier eruptions are inferred.


Mount Merapi as seen from Borobudur: image ghumakkar.com


Mt. Merapi eruptions continue into second week

November 5, 2010

AFP reports:

Merapi eruption

ARGOMULYO, Indonesia: At least 49 people were killed and scores injured Friday when Indonesia’s Mount Merapi volcano erupted again, incinerating villages as far as 18 kilometres (11 miles) away, officials said. The latest deaths bring the total toll to more than 90 since the country’s most active volcano started erupting on October 26. Ash, deadly heat clouds and molten debris gushed from the mouth of the 2,914-metre (9,616-foot) mountain and shot high into the sky for most of the night and into the morning.

The ranks of evacuees swelled past 100,000 people, with 30,000 moved into a sports stadium about 25 kilometres away from the peak. “The emergency shelters are now overcrowded,” emergency response field coordinator Widi Sutikno said.

The international airport at Yogyakarta was closed as ash clouds billowed to the altitude of cruising jetliners and the runway was covered in gray soot, officials said. The exclusion zone was widened from 15 to 20 kilometres around the mountain and everyone living in the area was ordered to evacuate their homes and shelters immediately, he said. Indonesia’s transport ministry has told pilots to stay at least 12 kilometres away from the rumbling volcano and several flights linking central Java to Singapore and Malaysia have been cancelled this week.

Government volcanologist Surono said Friday’s blasts were the largest yet.

Mt. Merapi: map credit hobotraveler.com