Archive for the ‘Climate’ Category

Signs of global cooling accumulate while IPCC denies evidence and relies on models

November 2, 2014

Rational argument cannot penetrate faith.

Ask for evidence and you get model results. Ask for proof that the models are valid and you get hindcasts based on adjusted data. Ask for evidence of man-made emissions causing global warming and the answer is that it must be so for there is no other explanation. There isn’t if you don’t want to see it.

The IPCC believes that model results – even where the models are wrong – provide “conclusive” evidence of not just man-made global warming but that it is due to the emissions of carbon dioxide. It is politics not science. And the politics from India and China have ensured that the IPCC accepts fossil fuels till 2100!!!

For there is – in fact – no actual evidence in the form of data or measurements. There are only model results. There are only model forecasts where the track record shows that every IPCC forecast has been wrong. Fossil fuels – especially gas – will be around and will continue for many hundreds of years unless cheap fusion comes earlier.

Instead of real data showing support for the models, the evidence is accumulating that not only are the models wrong, but also that there are more indications that a global cooling is underway rather than global warming. Real measurements and real data show:

  1. that global temperatures have been stagnant for 18 years while carbon dioxide emissions have increased by 70% and carbon dioxide concentration has increased just under 15%,
  2. that therefore carbon dioxide concentration in the atmosphere has had no significant effect on global temperature,
  3. that the emissions and absorption of carbon dioxide from “natural” causes has an uncertainty of around 10%
  4. that man made carbon dioxide emissions make up less than 5% of all carbon dioxide emissions and their contribution to carbon dioxide concentration is of the order of 40% (assuming that there is no lag between accumulation of carbon dioxide in the atmosphere and absorption mechanisms from the atmosphere),
  5. that global temperatures actually show a small downward trend over the last 10 years,
  6. that global temperatures of the past have been corrupted by being adjusted or otherwise homogenised with the intent (conscious or unconscious) to cool the past,
  7. that man-made carbon dioxide emissions have been overestimated and in reality are much lower as a proportion of natural emission sources,
  8. that natural carbon dioxide absorption processes are larger than assumed,
  9. that Antarctic ice cover is at the highest levels ever recorded,
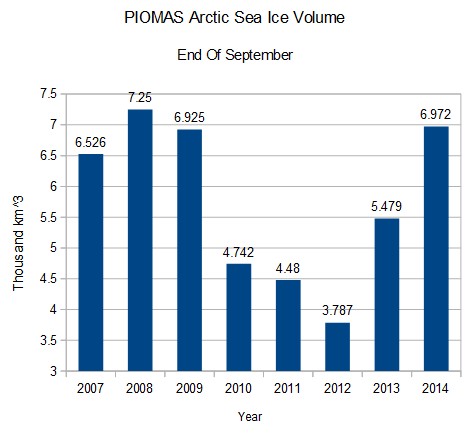
  10. that Arctic ice cover has returned to be within 1 SD of the long term 1980-2010 average,
  11. that the rate of sea-level rise is still at the same rate as the long-term recovery from the last glacial,
  12. that snow cover in the northern hemisphere is increasing
  13. that ice cover on the Great Lakes is increasing,
  14. that there is more forest cover now than when the alarmism began, and
  15. that polar bear numbers are healthy and increasing,

Add to this that a VEI5+ volcano eruption has not occurred since 1991 and is long overdue. It will most likely show up along the Pacific Ring of Fire or in Indonesia. Consider also that the Bárðarbunga  volcano in Iceland has been producing sulphur dioxide at a rate which in 9 weeks has pumped twice as much SO2 into the atmosphere than all of Europe does in a year. Bárðarbunga  volcano is far from VEI5+ levels and the eruption could continue for months. The SO2 emissions are not all reaching the stratosphere but will surely lead to increased cloud formation around sulphur aerosols and cloud levels will probably be high through at least next year. It becomes increasingly clear that further cooling effects are already in the “natural” pipeline of events. Some new glacier formation has been observed in the Scottish highlands. Some Alpine and Himalayan glaciers have started to increase and while others still decrease, the observation of increase where there has been none before is highly significant. The Great lakes have seen unprecedentedly high ice cover levels. Snow cover in the northern hemisphere is high and is lasting longer into spring than for some time.

But the models and the presuppositions and the misconceptions of the religious high priests cannot be easily denied by the faithful and have an inertia of their own. The IPCC  remains delusional and in denial about reality. It continues to play its global warming fiddle but it is badly out of tune and its alarmist cacophony is being overtaken by real events.

It may not be a glacial age that is starting but another Little Ice Age looks like it is on its way.

Reanalysis reveals no significant global warming in New Zealand in the 20th century

October 31, 2014

New Zealand has one of the longest temperature-time series available.  In the past it has been reported that this data-set  confirms the view of global warming of just under 1ºC per century. But that is now highly suspect. A new paper reanalysing the data has been published and shows that the trend is less than one-third of what has been previously assumed.

de Freitas, C.R., Dedekind, M.O. and Brill, B.E. 2014. A reanalysis of long-term surface air temperature trends in New Zealand. Environmental Modeling and Assessment, do1 10.1007/s10666-014-9429-z.

AbstractDetecting trends in climate is important in assessments of global change based on regional long-term data. Equally important is the reliability of the results that are widely used as a major input for a large number of societal design and planning purposes. New Zealand provides a rare long temperature time series in the Southern Hemisphere, and it is one of the longest continuous climate series available in the Southern Hemisphere Pacific. It is therefore important that this temperature dataset meets the highest quality control standards. New Zealand’s national record for the period 1909 to 2009 is analysed and the data homogenized. Current New Zealand century-long climatology based on 1981 methods produces a trend of 0.91 °C per century. Our analysis, which uses updated measurement techniques and corrects for shelter-contaminated data, produces a trend of 0.28 °C per century.

Dr. Craig Idso writes:

De Freitas et al. report that, whereas the previous analysis yielded a trend of 0.91 ± 0.30°C per century, their analysis – which used updated measurement techniques and corrects for shelter-contaminated data – produces a trend of only 0.28 ± 0.29°C per century, which is a heck of a lot less than what had previously been believed to have been the case.

The significance of de Freitas et al.’s work is two-fold. First, the authors report that the old, contaminated data with the inflated warming trend has been “widely used as inputs for societal design and planning purposes” all across New Zealand. Second, de Freitas et al. note these data are “extensively used in hindcast verifications for regional and local models.” However, as the saying goes, “garbage in equals garbage out.” Therefore, at best, the corrected New Zealand temperature trend, which is three times smaller than the uncorrected version, calls into question all results, findings, conclusions, and policies built upon or derived from the old contaminated data record. And at worst, it invalidates them.

Given the great importance of starting with the proper baseline, one would hope that with so much at stake in terms of economics, personal freedoms, and governance, much greater care and scrutiny would be applied to ensuring the quality and reliability of near-surface air temperature records. But obviously, such has not been the case for New Zealand. And it begs the question as to where else temperature records might be less than par.

To obtain a “global temperature”, raw temperature data from available sites is massaged, applied to geographical grids, corrected, adjusted, “filled-in” and otherwise homogenised. But the algorithms used to make these adjustments inevitably carry the preconceptions and misconceptions of the adjusters. As raw data is reviewed it is becoming increasingly obvious (in the US, in Australia in Germany and now in New Zealand) that “adjustments” that have been made over the last 20 years have been plagued by “confirmation bias”. Rather than a clear-cut warming record what is apparent is that many data-sets have been adjusted to “cool the past”.

US shale oil boom visible from space

October 21, 2014

The drop in oil prices continues though somewhat slowed down by Chinese import demand:

WSJU.S. and global crude benchmarks ended lower Monday amid choppy trading and concerns that member nations of the Organization of the Petroleum Exporting Countries will maintain high production levels in a bid to compete for market share despite growing global crude supplies.

The current drop in oil prices is put down to a glut on the market caused by the boom in shale oil production in the US and the slow-down in the global economy.

The boom in shale oil production is even visible from space.

Satellite Images Reveal How the U.S. Oil Boom Is Creating New Cities

bakken shale field shows up from space Image NASA/io9

io9This image from NASA reveals a massive cluster of lights in what was — until recently — desolate prairie. This is the Bakken Shale, an oil-rich rock formation stretching across parts of North Dakota, Montana and Canada. The lights are from the illuminated derricks, local boomtowns and gas flares of the oil fields.

Misguided alarmists who have demonised fossil fuels don’t like this. But I find the picture and the visibility of the shale production greatly encouraging. Carbon dioxide has no significant deleterious impact on climate and the availability of fossil energy is what will ensure continued human development.

The Bakken Shale field is a vast resource across Montana, North Dakota, Sasketchewan and Manitoba and a significant contributor to the game changing advent of shale oil and shale gas.

The Bakken Shale ranks as one of the largest oil developments in the U.S. in the past 40 years. The play has single-handedly driven North Dakota’s oil production to levels four times higher than previous peaks in the 1980s. As of 2012, ND is second to Texas in terms of oil production and boasts the lowest unemployment rate in the country at ~3%.

The Bakken Shale Play is located in Eastern Montana and Western North Dakota, as well as parts of Saskatchewan and Manitoba in the Williston Basin. Oil was initially discovered in the Bakken play in 1951, but was not commercial on a large scale until the past ten years.

… The Bakken is estimated to hold as much as 400 billion barrels of oil equivalent in place.

US shale fields map EIA


IFRC: In 2013, deaths by natural disasters were 80% down from average

October 19, 2014

The “climate change” brigade would have us believe that every storm, every hurricane, every incidence of heavy rain and every blizzard is an unprecedented event and due to man-made global warming (which in turn, they would have us believe, is primarily due to the combustion of fossil fuels).

But they are denied by the numbers.

The International Federation of the Red Cross and Red Crescent Societies has published its “World Disasters Report 2014”. They compile data for both natural and technological disasters. Last year (2013) saw deaths by natural disaster at very low levels (22,452) and about 20% of the decadal average (97,954). Regarding natural disasters they say:

According to the Centre for Research on the Epidemiology of Disasters (CRED), 337 disasters related to natural hazards and 192 related to technological hazards (typified hereafter as “natural disasters” and “technological disasters”) were reported worldwide in 2013. The number of natural disasters was the lowest of the decade. As regards technological disasters, their number was the second lowest of the decade, almost half the number in 2005, the peak year of the decade.

Floods remain the most frequent natural disasters. Storms were the second most frequent, but the number of events in 2013 was slightly higher than the decade’s average.

The number of deaths caused by natural disasters (22,452) is almost 80 per cent below the average for the decade (97,954), much lower than the peak years of 2004 (242,829 deaths), 2008 (235,272 deaths) and 2010 (297,728 deaths).

IFRC Deaths by natural disaster

IFRC Deaths by natural disaster

Monetary losses are dominated by the effects of earthquakes and tsunamis – when they occur. Windstorm deaths are also sporadic. Floods are more regular.

IFRC Monetary Losss by disaster type

IFRC Monetary Losss by disaster type

Sea surface temperature and the 18.6 year lunar nodal cycle

October 15, 2014

There is a growing body of scientific papers (some reported in my post here) which show long period connections between the 18.6 year lunar nodal cycles and sea level, tidal sedimentation, tidal mixing, sea surface temperature, Arctic climate and even drought. The mechanisms by which these influences are transmitted are hypothesised but are not known.

Compared to solar cycles the lunar cycles are not well known:

The lunar nodal cycle is not something that is very well known but it is another celestial cycle which is clearly not to be ignored. Naturally the IPCC takes no notice of solar cycles, planetary cycles or lunar cycles and all these are lumped into what could be considered “natural variability”.

(Sourced from Wikipedia)

The lunar orbit is inclined by about 5 degrees on the ecliptic. The moon  therefore can lie up to about 5 degrees north or south of the ecliptic. The ecliptic is the plane of the apparent path of the Sun on the celestial sphere, and is coplanar with both the orbit of the Earth around the Sun and the apparent orbit of the Sun around the Earth.

File:Lunar eclipse diagram-en.svg

Lunar eclipse orbital diagram: wikipedia

The lunar nodes precess around the ecliptic, completing a revolution (called a draconitic or nodical period, the period of nutation) in 6793.5 days or 18.5996 years.

The effects of the 18.6 year lunar nodal cycle on climate on tides and geological sediments and on weather and climate have long been of interest (though not apparently for the IPCC).

The lunar nodes and the nodal cycles were known even to ancient astronomy (Greek, Hindu, Tibetan…) and has found a place in both Eastern and Western astrology. Since astrology is not considered “scientific”, suggestions that the lunar nodal cycle has any impact on the earth’s geology and climate are very often treated with ridicule. Yet the undoubted lunar effects on tides and tidal sedimentation and (therefore) geologic events are not disputed. The nodal period also controls when eclipses can occur.

Eclipses occur only near the lunar nodes: Solar eclipses occur when the passage of the Moon through a node coincides with the new moon; lunar eclipses occur when passage coincides with the full moon. A lunar eclipse may occur if there is a full moon within 11° 38′ (Celestial Longitude), of a node, and a solar eclipse may occur if there is a new moon within 17° 25′ of a node.

It is not surprising that the ancient astrologers/astronomers attributed many effects to the lunar nodes and the nodal cycles:

In Hindu astronomy, the ascending node is called Rahu and the descending node is called Ketu. Rahu and Ketu are thus the north and the south lunar nodes. Rahu represents the severed head of an asura, that swallows the sun causing eclipses. Times of day considered to be under the influence of Rahu are considered inauspicious even today in many parts of India (for weddings, starting journeys …..)

A new paper considers the effects of the 18.6 year lunar nodal cycle on Sea Surface Temperature (SST) and the Pacific Decadal Oscillation (PDO).

S. Osafune, S. Masuda and N. Sugiura, Role of the oceanic bridge in linking the 18.6-year modulation of tidal mixing and long-term SST change in the North Pacific, Geophysical Research Letters, DOI: 10.1002/2014GL061737

HockeyShtick reports:

A paper published today in Geophysical Research Letters finds a “significant contribution” of the 18.6 year lunar-tidal cycle to “wintertime sea surface temperatures near the center of action of the Pacific Decadal Oscillation [PDO] in the eastern Pacific,” and that

“This result supports the hypothesis that the 18.6-year tidal cycle influences long-term variability in climate; thus, knowledge of this cycle could contribute towards improving decadal predictions of climate.” [which IPCC climate models do not incorporate]

The approximately 60-year long Pacific Decadal Oscillation [PDO] in-turn profoundly affects global climate and interacts with other ocean and atmospheric oscillations. A very simple climate model based solely upon the sum of the sunspot integral, Pacific Decadal Oscillation [PDO], and Atlantic Multidecadal Oscillation [AMO] explains 96% of climate change over the 20th century: …..


Paper Abstract:The impact of the 18.6-year modulation of tidal mixing on sea surface temperature (SST) in the North Pacific is investigated in a comparative study using an ocean data synthesis system. We show that remote impact through a slow ocean response can make a significant contribution to the observed bidecadal variation in wintertime SST near the center of action of the Pacific Decadal Oscillation in the eastern Pacific. A comparative data synthesis experiment showed that the modified SST variation is amplified by bidecadal variation in the westerly wind. This relationship between SST and wind variations is consistent with an observed air–sea coupled mode in the extratropics, which suggests that a midlatitude air–sea interaction plays an important role in enhancing the climate signal of the 18.6-year modulation. This result supports the hypothesis that the 18.6-year tidal cycle influences long-term variability in climate; thus, knowledge of this cycle could contribute towards improving decadal predictions of climate.

I am of the opinion that climate is predominated by solar effects which are mediated primarily by the oceans over multidecadal periods and only over shorter periods by the atmosphere. And if lunar nodal cycles influence the tidal flows and tidal mixing then they will also influence the climate – also on the decadal scale.

We dance to a celestial music and the moon provides the variations on the climate themes set by the sun.


Evidence for man-made global warming has vanished

October 14, 2014

Where is the real evidence of man-made global warming? Where are the signs? Where are the measurements?

The simple fact is that in spite of what computer models might say, without global warming, there is no man-made global warming.

I am more persuaded by evidence than by climate models which have only demonstrated that they do not work. The man-made global warming hypothesis has a number of crucial assumptions which are all proving to be unproven, lacking evidence or just plain wrong.

  1. Global temperature is increasing, and
  2. Increasing carbon dioxide concentration in the atmosphere is due to man-made effects, and
  3. Increasing CO2 concentration does give measurably increasing global temperature, and
  4. Increasing man-made carbon dioxide emissions does give significant and measurable increases in global temperature.

Every one of these assumptions is suspect and- at best – uncertain.

“Global Warming” has warped to be “Climate Change” so that any slightly unusual weather event can be claimed to be man-made. The hypotheses are never falsifiable. But the bottom line remains that all the change can be put down to man-made emissions which increase the heat trapped on earth, which then cause global temperatures to rise and fuel the “climate changes” observed. But all man-made climate change vanishes without man-made global warming to power it.

The signs of global warming were touted as being ice melting, sea level rising, loss of polar wildlife and sundry other secondary catastrophes. The poster-children of the global warming religion were the loss of polar ice, the corresponding rise of sea levels, disappearing islands, and the extinction of polar bears.

Just consider the real evidence.

Antarctic sea ice cover has reached the highest levels ever measured and has reached record levels for each of the last 3 years

NSIDC: This year’s Antarctic sea ice maximum was 1.54 million square kilometers (595,000 square miles) above the 1981 to 2010 average maximum extent, which is nearly four standard deviations above this average. The 2014 ice extent record is 560,000 square kilometers (216,000 square miles) above the previous record ice extent set on October 1, 2013. Each of the last three years (2012, 2013, and 2014) has set new record highs for extent in the Antarctic.

Arctic sea ice cover has recovered from the low of 2012 and is now within the 2SD band of the 1981-2010 average. It is up 84% from 2012 and the trend is upwards.

ScreenHunter_3480 Oct. 09 15.16

The trend for Arctic ice is upwards

Global sea ice cover is unchanged and shows no discernible trend since 1979.

Global temperatures have not risen for 18 years. In recent years there may even be a cooling trend.

Forbes:Remote Sensing Systems(RSS) also compiles data from the satellite instruments, though RSS measures a slightly different range of the lower atmosphere. RSS reports a similar temperature history,available here. In the RSS compilation, we see not just a recent temperature plateau, but actual cooling. Again, the pace of warming throughout the entirety of the record is approximately 1 degree Celsius per century.

In the last 18 years man made carbon emissions have increased by about 70%. Over the same period carbon dioxide concentration in the atmosphere has risen by about 10% and global temperatures have not risen at all. On this data there is no correlation between global temperature and carbon dioxide concentration let alone carbon dioxide emissions.

Polar bear numbers are higher than for 50 years and walrus numbers are very high as well.

Sea level increases are no higher than the long term rise due to coming out of a glacial age. A rise of 2 inches by 2050 is on the cards.

Where is the evidence of man-made global warming?


Obama and the UN recycle 25 year old alarmist propoganda

September 24, 2014

At the UN summit on climate change Obama has been recycling the same alarmist propaganda that was coming out of the UN 25 years ago.

Reblogged from Real Science:

September 23rd, 2014

Dire warning on climate

President Obama on Tuesday delivered a call to arms against climate change at the United Nations, telling 125 leaders that they are “the last generation” with the power to prevent a global catastrophe.

Dire warning on climate | TheHill

Obama’s teleprompter is recycling identical UN propaganda from 25 years ago.

June 30, 1989

GRIM FORECAST

A senior environmental official at the United Nations, Noel Brown, says entire nations could be wiped off the face of the earth by rising sea levels if global warming is not reversed by the year 2000. Coastal flooding and crop failures would create an exodus of “eco-refugees,” threatening political chaos, said Brown, director of the New York office of the U.N. Environment Program. He said governments have a 10-year window of opportunity to solve the greenhouse effect before it goes beyond human control

San Jose Mercury News (CA) Mercury News: Search Results

Twenty five years of screeching while global warming has been absent for at least the last 18!! Twenty five years of proposing an ineffective solution to the wrong problem. Twenty five years of proposing actions which have no measurable objectives.

Antarctic sea ice extent at the highest ever measured

September 16, 2014

Antarctic ice extent is at all time high levels. Since satellite measurement began in 1978, such high levels of ice extent have never been measured.

An area about three times the size of Australia, in the Antarctic region, is now covered by sea ice.

And even the growing ice is blamed by the acolytes on global warming in the atmosphere (which they seem to forget has been absent for 18 years)!! Of course the missing warming is said to be hiding in the deep oceans (among many other places) but not – it would seem – in the Antarctic.

CEO of the Antarctic Climate and Ecosystems CRC, Tony Worby, said the warming atmosphere is leading to greater sea ice coverage by changing wind patterns.

Sunshinehours:

Antarctic Sea Ice Extent Sept 15 2014 – 1,224,000 sq km above the 1981-2010 mean. Data for Day 257. Data here.

18,000 sq km higher than yesterdays record. And 170,000 sq km higher than 2013’s all-time record.

Antarctic sea ice extent 2014 day 257 image sunshinehours

Antarctic sea ice extent 2014 day 257 image sunshinehours

abc.net

Satellite image showing Antarctic sea ice

A satellite image of Antarctica showing sea ice extent. The red line is the average for September – Antarctic Climate and Ecosystems CRC

Obsessive fixation on global warming leads to unpreparedness for an ice age

September 14, 2014

This is a postscript to my previous post about the inevitability of this interglacial giving way to glacial conditions, Here Professor Bob Carter addresses how the obsessive fixation with “gentle” global warming leads to an unpreparedness for global cooling in a letter to The Australian:

Heading for ice age

GRAHAM Lloyd has reported on the Bureau of Meteorology’s capitulation to scientific criticism that it should publish an accounting of the corrections it makes to temperature records (“Bureau warms to transparency over adjusted records”, 12/9). Corrections which, furthermore, act to reinforce the bureau’s dedication to a prognosis of future dangerous global warming, by turning cooling temperature trends into warming ones — a practice also known to occur in the US, Britain and New Zealand.

Meanwhile, we have a report by Sue Neales that the size of our grain harvest remains in doubt following severe frosts in southern NSW killing large areas of early wheat crops and also damaging wheat and canola crops in South Australia and Victoria (“Trifecta of calamities to deplete. crop harvest”, 12/9)

Is it unreasonable to be surprised that none of your writers, much less the government, has noticed that leading solar astrophysicists, such as Habibullo Abdussamatov from Pulkovo Observatory in St Petersburg, have for years been commenting on the declining activity of the sun?

These scientists are projecting a significant cooling over the next three decades, and perhaps even the occurrence of another little ice age.

Obsessed as they are with a gentle global warming trend that stopped late last century, should the expected solar cooling eventuate, policy makers will rue the day they failed to heed the advice of independent scientists on climate change issues.

Bob Carter, Townsville, Qld


How will we know when the transition to a new glacial age has started?

September 13, 2014

Once glacial conditions have been established (and they will), they will be unmistakable. Ice sheets will have covered large parts of the northern hemisphere making large swathes uninhabitable. Sea levels would have dropped by about 100 m. Global mean temperature would be around 10-12 ºC rather than the 15 ºC in an interglacial.

Glacials and interglacials graphic http://anthro.palomar.edu/

Habitable and fertile land would have increased around the equator and in the tropics – but not as much as would be rendered uninhabitable by the ice sheets. Modern technology and recourse to energy would still allow some exploitation of resources under the ice sheets. Precipitation levels would reduce however (with so much of the water cycle being bound up in the ice sheets). Some of the equatorial regions would see a desertification. New resources would be available due to the 100 m drop in sea level. Population would probably be significantly lower than during an interglacial but what population could be sustained comfortably will be strongly dependent upon the availability of energy and the ease of energy conversion. River flows and hydropower will dry up. Fossil fuels and nuclear energy is what will make the difference.

Ice sheets graphic http://anthro.palomar.edu

But whenever it comes, it will not happen overnight. It would take not less than a few hundred years for the transition from interglacial to glacial conditions but it might take 1000 years or more.

interglacials

The next glacial will come …

But how will we know if the transition has started? What are the signs to look for? For example a few years of reduction of global precipitation may mean nothing if at the same time an increase of water locked up as ice is not also evident.

Probably the most potent feedback loops (forcings) for the transition to glacial conditions is the ice cover on the earth’s surface and the cloud cover in the upper reaches of our atmosphere. Both of these act directly on the sun’s energy being reflected away from the earth and will shift the earth to a different paradigm of solar energy input. There may be other parameters which cause incoming solar insolation to vary but how much the earth reflects away of whatever is coming in is controlled by the ice and the high clouds. We can consider the interglacial and glacial conditions to be semi-stable equilibrium conditions, each representative of a particular level of solar energy input to the earth system.

So the first real indicators will be the growth of ice cover and an increase in high clouds. All other prior indicators  must finally show up as ice cover or high cloud. Even global temperature (which is merely an averaged, composite, weighted artefact) is not of great relevance except when it shows up as ice or cloud. Note that ice cover at a lower latitude is of greater significance since it causes a greater reduction of received solar insolation than at the poles. For ice cover to be on an increasing path we will first see a reduction in the melt of the previous season’s ice – regularly. We should see this not only at both poles but also at lower latitudes on high ground. We will see warming factors being neutralised. We will see a decrease in precipitation but this will probably lag the reduction of ice cover and the reduction of sea level by many years. It might begin to show up first as a reduction of low rain clouds and increase of high clouds. We should see the sea level increase characteristic of an interglacial, level off and then begin to fall – slowly at first and then accelerating.

An impulse or trigger is needed to shift from one semi-stable equilibrium state to another. What that trigger – or those impulses –  might be is unknown. But I note that

  1. A cooling cycle of 30 + years may have begun and may well be a trigger for a transition.
  2. Expected global temperature increase due to the undoubted (but small) effect of carbon dioxide concentration in the atmosphere is not happening and will not any time soon.
  3. Expected increase of sea level (even if based on fallacious CO2 based climate models) is not happening and sea level rise seems to be decelerating.
  4. Antarctic ice cover is at its highest level ever and has been increasing over the last few years.
  5. Arctic ice has recovered from its decrease of a few years ago and is at the same level as about 2 decades ago.
  6. Some unusual sign of fresh glacier formation have been observed on Ben Nevis.
  7. Some Himalayan glaciers. and even Alpen glaciers have shown signs of growth or reduced rates of decrease.

Just indicators of course – and another 50 or so years should tell.

But one thing is clear. Our future depends upon the availability of energy – and that will be primarily fossil and nuclear (and fusion if that has been developed by then). The pointless (and futile) attempts to curtail exploration for and the use of fossil fuels will have to cease – and better they be abandoned sooner rather than later.