Archive for the ‘Mathematics’ Category

Numeracy and language

December 2, 2013

I tend towards considering mathematics a language rather than a science. In fact mathematics is more like a family of languages each with a rigorous grammar. I like this quote:

R. L. E. SchwarzenbergerThe Language of Geometry, in A Mathematical Spectrum Miscellany, Applied Probability Trust, 2000, p. 112:

My own attitude, which I share with many of my colleagues, is simply that mathematics is a language. Like English, or Latin, or Chinese, there are certain concepts for which mathematics is particularly well suited: it would be as foolish to attempt to write a love poem in the language of mathematics as to prove the Fundamental Theorem of Algebra using the English language.

Just as conventional languages enable culture and provide a tool for social communication, the various languages of mathematics, I think, enable science and provide a tool for scientific discourse. I take “science” here to be analaogous to a “culture”. To follow that thought then, just as science is embedded within a “larger” culture, so is mathematics embedded within conventional languages. This embedding shows up as the ability of a language to deal with numeracy and numerical concepts.

And that means then the value judgement of what is “primitive” when applied to language can depend upon the extent to which mathematics and therefore numeracy is embedded within that language.

GeoCurrents examines numeracy embedded within languages:

According to a recent article by Mike Vuolo in Slate.com, Pirahã is among “only a few documented cases” of languages that almost completely lack of numbers. Dan Everett, a renowned expert in the Pirahã language, further claims that the lack of numeracy is just one of many linguistic deficiencies of this language, which he relates to gaps in the Pirahã culture. ….. 

The various types of number systems are considered in the WALS.info article on Numeral Bases, written by Bernard Comrie. Of the 196 languages in the sample, 88% can handle an infinite set of numerals. To do so, languages use some arithmetic base to construct numeral expressions. According to Comrie, “we live in a decimal world”: two thirds of the world’s languages use base 10 and such languages are spoken “in nearly every part of the world”. English, Russian, and Mandarin are three examples of such languages. ….. 

Around 20% of the world’s languages use either purely vigesimal (or base 20) or a hybrid vigesimal-decimal system. In a purely vigesimal system, the base is consistently 20, yielding the general formula for constructing numerals as x20 + y. For example, in Diola-Fogny, a Niger-Congo language spoken in Senegal, 51 is expressed as bukan ku-gaba di uɲɛn di b-əkɔn ‘two twenties and eleven’. Other languages with a purely vigesimal system include Arawak spoken in Suriname, Chukchi spoken in the Russian Far East, Yimas in Papua New Guinea, and Tamang in Nepal. In a hybrid vigesimal-decimal system, numbers up to 99 use base 20, but the system then shifts to being decimal for the expression of the hundreds, so that one ends up with expressions of the type x100 + y20 + z. A good example of such a system is Basque, where 256 is expressed as berr-eun eta berr-ogei-ta-hama-sei ‘two hundred and two-twenty-and-ten-six’. Other hybrid vigesimal-decimal systems are found in Abkhaz in the Caucasus, Burushaski in northern Pakistan, Fulfulde in West Africa, Jakaltek in Guatemala, and Greenlandic. In a few mostly decimal languages, moreover, a small proportion of the overall numerical system is vigesimal. In French, for example, numerals in the range 80-99 have a vigesimal structure: 97 is thus expressed as quatre-vingt-dix-sept ‘four-twenty-ten-seven’. Only five languages in the WALS sample use a base that is neither 10 nor 20. For instance, Ekari, a Trans-New Guinean language spoken in Indonesian Papua uses base of 60, as did the ancient Near Eastern language Sumerian, which has bequeathed to us our system of counting seconds and minutes. Besides Ekari, non-10-non-20-base languages include Embera Chami in Colombia, Ngiti in Democratic Republic of Congo, Supyire in Mali, and Tommo So in Mali. …… 

Going back to the various types of counting, some languages use a restricted system that does not effectively go above around 20, and some languages are even more limited, as is the case in Pirahã. The WALS sample contains 20 such languages, all but one of which are spoken in either Australia, highland New Guinea, or Amazonia. The one such language found outside these areas is !Xóõ, a Khoisan language spoken in Botswana. ……. 
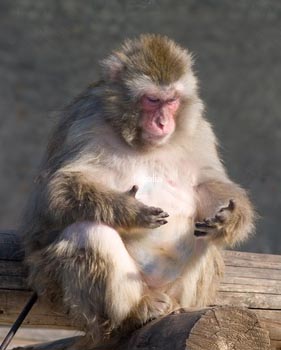
Read the whole article. 

Counting monkey?

In some societies in the ancient past, numeracy did not contribute significantly to survival as probably with isolated tribes like the Pirahã. But in most human societies, numeracy was of significant benefit especially for cooperation between different bands of humans. I suspect that it was the need for social cooperation which fed the need for communication within a tribe and among tribes, which in turn was the spur to the development of language, perhaps over 100,000 years ago. What instigated the need to count is in the realm of speculation. The need for a calendar would only have developed with the development of agriculture. But the need for counting herds probably came earlier in a semi-nomadic phase. Even earlier than that would have come the need to trade with other hunter gatherer groups and that  probably gave rise to counting 50,000 years ago or even earlier. The tribes who learned to trade and developed the ability and concepts of trading were probably the tribes that had the best prospects of surviving while moving from one territory to another. It could be that the ability to trade was an indicator of how far a group could move.

And so I am inclined to think that numeracy in language became a critical factor which 30,000 to 50,000 years ago determined the groups which survived and prospered. It may well be that it is these tribes which developed numbers, and learned to count, and learned to trade that eventually populated most of the globe. It may be a little far-fetched but not impossible that numeracy in language may have been one of the features distinguishing Anatomically Modern Humans from Neanderthals. Even though the Neanderthals had larger brains and that we are all Neanderthals to some extent!

From Mandelbrot to Mandelbulbs with Chaos in between

October 31, 2013

The Mandelbulb is a three-dimensional analogue of the Mandelbrot set, constructed by Daniel White and Paul Nylander using spherical coordinates. A canonical 3-dimensional Mandelbrot set does not exist, since there is no 3-dimensional analogue of the 2-dimensional space of complex numbers. It is possible to construct Mandelbrot sets in 4 dimensions using quaternions. However, this set does not exhibit detail at all scales like the 2D Mandelbrot set does.

From bugman123

an 8th order Mandelbulb set by bugman123

Here is my first rendering of an 8th order Mandelbulb set, based on the following generalized variation of Daniel White’s original squarring formula:
{x,y,z}n = rn{cos(θ)cos(φ),sin(θ)cos(φ),-sin(φ)}

Paul Nylander, bugman123.com

A classic Mandelbrot set

Mandelbrot set – Wikipedia

The mathematics of a pizza bite (by Sheffield University for Pizza Express)

October 19, 2013

English: Picture of an authentic Neapolitan Pi...

It is now crystal clear.  Eugenia Cheng is both a mathematician and a pizza lover.

A median bite from an 11” pizza has 10% more topping than a median bite from the 14” pizza.

On the perfect size for a pizza

cheng-pizza pdf
Eugenia Cheng
School of Mathematics and Statistics, University of Sheffield
E-mail: e.cheng@sheffield.ac.uk
October 14th, 2013
Abstract
We investigate the mathematical relationship between the size of a pizza and its ratio of topping to base in a median bite. We show that for a given recipe, it is not only the overall thickness of the pizza that is affected by its size, but also this topping-to-base ratio.

Acknowledgements: This study was funded by Pizza Express.

The ratio of topping to base in a median bite is given by

Formula for median pizza bite (Cheng)

where

r = radius of pizza (half the diameter) in inches
d = volume of dough (constant)
t = volume of topping (constant)
α = scaling constant for the edge

The IPCC 95% trick: Increase the uncertainty to increase the certainty

October 17, 2013

Increasing the uncertainty in a statement to make the statement more certain to be applicable is an old trick of rhetoric. Every politician knows how to use that in a speech. It is a schoolboy’s natural defense when being hauled up for some wrongdoing. It is especially useful when caught in a lie. It is the technique beloved of defense lawyers in TV dramas. Salesmen are experts at this. It is standard practice in scientific publications when experimental data does not fit the original hypothesis.

Modify the original statement (the lie) to be less certain in the lie, so as to be more certain that the statement could be true. Widen the original hypothesis to encompass the actual data. Increase the spread of the deviating model results to be able to include the real data within the error envelope.

  • “I didn’t say he did it. I said somebody like him could have done it”
  • “Did you start the fight?” >>> “He hit me back first”.
  • “The data do not match your hypothesis” >>> “The data are not inconsistent with the improved hypothesis”
  • “Your market share has reduced” >>> “On the contrary, our market share of those we sell to has increased!” (Note -this is an old one used by salesmen to con “green” managers with reports of a 100% market share!!)

And it is a trick that is not foreign to the IPCC  – “we have a 95% certainty that the less reliable (= improved) models are correct”. Or in the case of the Cook consensus “97% of everybody believes that climate does change”.

A more rigorous treatment of the IPCC trick is carried out by Climate Audit and Roy Spencer among others but this is my simplified explanation for schoolboys and Modern Environ-mentalists.

The IPCC Trick

The IPCC Trick

The real comparison between climate models and global temperatures is below:

Climate Models and Reality

Climate Models and Reality

With the error in climate models increased to infinity, the IPCC could even reach 100% certainty. As it is the IPCC is 95% certain that it is warming – or not!

Mathematical turbulence at Ege University, Turkey

August 28, 2013

Back in June I had reported on the strange case at Ege University

Retraction Watch reports on the retraction of a paper by a Turkish mathematician for plagiarism. The author did not agree with the retraction.

But what struck me was the track record of this amazing Assistant Professor at Ege University.

Ahmet Yildirim Assistant Professor, Ege University, Turkey

Editorial Board Member of International Journal of Theoretical and Mathematical Physics

  • 2009       Ph.D      Applied Mathematics, Ege University (Turkey)
  • 2005       M.Sc      Applied Mathematics, Ege University (Turkey)
  • 2002       B.Sc        Mathematics, Ege University (Turkey)

Since 2007 he has a list of 279 publications!

That’s an impressive rate of about 50 publications per year. Prolific would be an understatement.

But the link to his 279 publications is now broken which now only goes to a blank page.

Upon a little further investigation it became clear that not only does he no longer work at Ege University but that his PhD has also apparently been revoked.

Paul Wouters writes:

In mathematics and computer science, Ege university has produced 210 publications (Stanford wrote almost ten times as much). Because this is a relatively small number of publications, the reliability of the ranking position is fairly low, which is indicated by a broad stability interval (an indication of the uncertainty in the measurement). Of the 210 Ege University publications, no less than 65 have been created by one person, a certain Ahmet Yildirim. This is an extremely high productivity in only 4 years in this specialty. Moreover, the Yildirim publications are indeed responsible for the high ranking of Ege University: without them, Ege University would rank around position 300 in this field. This position is therefore probably a much better reflection of its performance in this field. Yildirim’s publications have attracted 421 citations, excluding the self-citations. Mathematics is not a very citation dense field, so this level of citations is able to strongly influence both the PP(top10%) and the MNCS indicators.

An investigation into Yildirim’s publications has not yet started, as far as we know. But suspicions of fraud and plagiarism are rising, both in Turkey and abroad. One of his publications, in the journal Mathematical Physics, has recently been retracted by the journal because of evident plagiarism (pieces of an article by a Chinese author were copied and presented as original). Interestingly, the author has not agreed with this retraction. A fair number of Yildirim’s publications have been published in journals with a less than excellent track record in quality control.  ….. 

How did Yildirim’s publications attract so many citations? His 65 publications are cited by 285 publications, giving in total 421 citations. This group of publications has a strong internal citation traffic. They have attracted almost 1200 citations, of which a bit more than half is generated within this group. In other words: this set of publications seems to represent a closely knit group of authors, but they are not completely isolated from other authors. If we look at the universities citing Ege University, none of them have a high rank in the Leiden Ranking with the exception of Penn State University (which ranks at 112) that has cited Yildirim once. If we zoom in on mathematics and computer science, virtually all of the citing universities do not rank highly either, with the exception of Penn State (1 publication) and Gazi University (also 1 publication). The rank position of the last university, by the way, is not so reliable either, as indicated by the stability interval that is almost as wide as in the case of Ege University.

And a commenter at Poul Waters site adds:

kuantumcartcurt Says:
July 4, 2013 at 12:30 PM

Thanks for this detailed post. It seems that Ahmet Yıldırım’s PhD was recently revoked since it was a direct translation of a book of Ji-Huan He who is also quite a questionable figure in academia (http://elnaschiewatch.blogspot.com.es/2011/02/ji-huan-he-loses-ijnsns.html). It also seems that he was dismissed from the university (again without any official statement).

Here is Ahmet Yıldırım’s PhD ‘thesis’:https://docs.google.com/file/d/0BxUoSj9K4YfeNDIwUUZGRWU1R2c/edit?pli=1
And this is Ji-Huan He’s book: https://docs.google.com/file/d/0BxUoSj9K4YfeZmZvdGpDQUVWY0E/edit?pli=1

It would seem that Ege University is carrying out some house cleaning but neither the University nor the International Journal of Theoretical and Mathematical Physics is saying anything.

Integrated Assessment Climate models tell us “very little”

August 24, 2013

Mathematical models are used – and used successfully – everyday in Engineering, Science, Medicine and Business. Their usefulness is determined – and some are extremely useful – by knowing their limitations and acknowledging that they only represent an approximation of real complex systems.  Actual measurements always override the model results and whenever reality does not agree with model predictions it is usually mandatory to adjust the model. Where the adjustments can only be made by using “fudge factors” it is usually necessary to revisit the simplifying assumptions used to formulate the model in the first place.

But this is not how Climate Modelling Works. Reality or actual measurements are not allowed to disturb the model or its results for the far future. Fudge factors galore are introduced to patch over the differences when they appear. The adjustments to the model are just sufficient to cover the observed difference to reality but such that the long-term “result” is maintained.

The assumption that carbon dioxide has a significant role to play in global warming is itself hypothetical. Climate models start with that as an assumption. They don’t address whether there is a link between the two. Some level of warming is assumed to be the consequence of a doubling the carbon dioxide concentration in the atmosphere. For the last 17 years global temperature has stood still while carbon dioxide concentration has increased dramatically. There is actually more evidence to hypothesise that there is no link (or a very weak link) between carbon dioxide and global warming than that there is. Nevertheless all climate models start with the built-in assumption that the link exists. And then use the results of the model as proof that the link exists! They are not just cyclical arguments – they are incestuous – or do I mean cannibalistic.

It is bad enough that economic models, developed to count the cost of carbon dioxide are first based on some hypothetical magnitude of the link between carbon dioxide emission and global warming as their starting point. But it gets worse. These “integrated assessment” models then themselves are strewn with new assumptions and further cyclical logic as to how the costs ensue.

A new paper by Prof. Robert Pindyck for the National Bureau of Economic Research takes a less than admiring look at the Integrated Assessment Climate models and their uselessness.

Robert S. PindyckClimate Change Policy: What Do the Models Tell Us?, NBER Working Paper No. 19244
Issued in July 2013

(A pdf of the full paper is here: Climate-Change-Policy-What-Do-the-Models-Tell-Us)

Abstract: Very little. A plethora of integrated assessment models (IAMs) have been constructed and used to estimate the social cost of carbon (SCC) and evaluate alternative abatement policies. These models have crucial flaws that make them close to useless as tools for policy analysis: certain inputs (e.g. the discount rate) are arbitrary, but have huge effects on the SCC estimates the models produce; the models’ descriptions of the impact of climate change are completely ad hoc, with no theoretical or empirical foundation; and the models can tell us nothing about the most important driver of the SCC, the possibility of a catastrophic climate outcome. IAM-based analyses of climate policy create a perception of knowledge and precision, but that perception is illusory and misleading.

Even though his assumptions about “climate sensitivity” are somewhat optimistic, he is more concerned with the assumptions made to try and develop the “damage” function to enable the cost to be estimated:

When assessing climate sensitivity, we at least have scientific results to rely on, and can argue coherently about the probability distribution that is most consistent with those results. When it comes to the damage function, however, we know almost nothing, so developers of IAMs [Integrated Assessment Models] can do little more than make up functional forms and corresponding parameter values. And that is pretty much what they have done. …..  

But remember that neither of these loss functions is based on any economic (or other) theory. Nor are the loss functions that appear in other IAMs. They are just arbitrary functions, made up to describe how GDP goes down when T goes up.

…. Theory can’t help us, Nor is data available that could be used to estimate or even roughly calibrate the parameters. As a result, the choice of values for these parameters is essentially guesswork. The usual approach is to select values such that L(T ) for T in the range of 2◦C to 4◦C is consistent with common wisdom regarding the damages that are likely to occur for small to moderate increases in temperature.

…… For example, Nordhaus (2008) points out (page 51) that the 2007 IPCC report states that “global mean losses could be 1–5% GDP for 4◦C of warming.” But where did the IPCC get those numbers? From its own survey of several IAMs. Yes, it’s a bit circular. 

The bottom line here is that the damage functions used in most IAMs are completely made up, with no theoretical or empirical foundation. That might not matter much if we are looking at temperature increases of 2 or 3◦C, because there is a rough consensus (perhaps completely wrong) that damages will be small at those levels of warming. The problem is that these damage functions tell us nothing about what to expect if temperature increases are larger, e.g., 5◦C or more.19 Putting T = 5 or T = 7 into eqn. (3) or (4) is a completely meaningless exercise. And yet that is exactly what is being done when IAMs are used to analyze climate policy.

And he concludes:

I have argued that IAMs are of little or no value for evaluating alternative climate change policies and estimating the SCC. On the contrary, an IAM-based analysis suggests a level of knowledge and precision that is nonexistent, and allows the modeler to obtain almost any desired result because key inputs can be chosen arbitrarily. 

As I have explained, the physical mechanisms that determine climate sensitivity involve crucial feedback loops, and the parameter values that determine the strength of those feedback loops are largely unknown. When it comes to the impact of climate change, we know even less. IAM damage functions are completely made up, with no theoretical or empirical foundation. They simply reflect common beliefs (which might be wrong) regarding the impact of 2◦C or 3◦C of warming, and can tell us nothing about what might happen if the temperature increases by 5◦C or more. And yet those damage functions are taken seriously when IAMs are used to analyze climate policy. Finally, IAMs tell us nothing about the likelihood and nature of catastrophic outcomes, but it is just such outcomes that matter most for climate change policy. Probably the best we can do at this point is come up with plausible estimates for probabilities and possible impacts of catastrophic outcomes. Doing otherwise is to delude ourselves.

….

What’s in a number? Defining a Mamillion

August 10, 2013

The New York Times reports today that the Japanese debt has reached one Quadrillion Yen (1015 Yen).

Japan’s soaring national debt, already more than twice the size of its economy, has reached a new milestone, surpassing one quadrillion yen.

A paltry million is the numeral one followed by six zeros. A billion? Nine zeros. A trillion is getting up there: 12 zeros. But the mighty quadrillion has 15 of them. … 

A quadrillion is a million billion, putting it into the kind of language used by middle schoolers to describe really humongous sums, along with gazillion and bazillion.

Measuring any currency in quadrillions brings to mind the hyperinflation of Germany between the wars, or Zimbabwe in the last decade. But a country with a real currency?

It is such a big and unusual word, describing such a big and unusual number, that its use is inconsistent: Bloomberg News used quadrillion in the headline of an early story on Friday about Japan’s debt, but later in the day the stories and headlines referred to a “thousand trillion,” which is not nearly as much fun.

…  How much is a quadrillion? The entire human body is said to have just 100 trillion cells; it takes 10 of us to make a quadrillion. Jeff Bezos has a personal fortune of some $25 billion, allowing him to plunk down $250 million for The Washington Post, which is essentially how much money he might find by looking behind his sofa cushions. To get to a quadrillion dollars, however, we would have to have 40,000 Bezoses, or as many people as live in Prescott, Ariz.

Neil deGrasse Tyson, the astrophysicist and director of the Hayden Planetarium at the American Museum of Natural History, helpfully offered a few other ways to think about a quadrillion. “It would take you 31 million years to count to a quadrillion — one number per second, never sleeping,” he said in an e-mail, adding that “a quadrillion yen, stacked in 1,000-yen notes, would ascend 70,000 miles high.”

He also wrote, though it is not clear how he would know such a thing, that “the total number of all sounds and words ever uttered by all humans who have ever lived is about 100 quadrillion.”

Numbers from 103 (Thousand) to 10123 (Quadragintillion) with the exponent increasing in steps of 3 and then upto 10603 (Ducentillion) in exponent steps of 30 and then upto 103003 (Milillion) in exponent steps of 300 have been named.

10100 is a Googol and 10Googol is a Googolplex.

But I cannot find a name for the relatively simple concept of one million raised to the power of one million.

A Zillion is undefined but language still needs such a word for a very large indeterminate number. Gazillion is often used instead of Zillion. The word “Million” itself is thought to have come about to represent a “Large Thousand” (from mille = thousand). A million raised to the power of itself would quite definitely be a Large Million.

So I propose a word to represent a “Large Million”, the mother of all millions,  a Ma Million

Mamillion = Millionmillion = 1,000,0001,000,000

Considering the magnitude of the current Japanese debt, it will be some time before the debt of the whole world reaches a Mamillion in whatever currency one cares to choose!.

Fractal Explorer

July 23, 2013

The ultimate fractal explorer!

This could well be the tool that Slartibartfast used to design the Norwegian fjords and is using for the African fjords he is designing for the alternate Earth!

From unwrong.com

fractal explorer

Click on the image to explore.

Slartibartfast is a venerable Magrathean planetary designer. He specialises in Fjords, having won an award for Norway.

He was woken from a five million year sleep by a final order for a duplicate Earth. Its premature demolition caused a terrible hooha, and a new copy was ordered from the original blueprints.

Slartibartfast on life:

The Fibonacci spiral applied

July 22, 2013

Mathematics is wonderful but numbers are transcendental.

fibonacci spiral

From twistedswifter

The Fibonacci Series – 0, 1, 1, 2, 3, 5, 8, 13, 21, 34, 55, 89, 144, ….

An approximation of the golden spiral created by drawing circular arcs connecting the opposite corners of squares in the Fibonacci tiling; this one uses squares of sizes 1, 1, 2, 3, 5, 8, 13, 21, and 34.

File:Fibonacci spiral 34.svg

Approximating the Golden Spiral: Wikipedia

Climate model results depend upon which computer they run on!

June 26, 2013

Robust models indeed.

Washington Post:

New Weather Service supercomputer faces chaos

The National Weather Service is currently in the process of transitioning its primary computer model, the Global Forecast System (GFS), from an old supercomputer to a brand new one.  However, before the switch can be approved, the GFS model on the new computer must generate forecasts indistinguishable from the forecasts on the old one.

One expects that ought not to be a problem, and to the best of my 30+ years of personal experience at the NWS, it has not been.  But now, chaos has unexpectedly become a factor and differences have emerged in forecasts produced by the identical computer model but run on different computers.

This experience closely parallels Ed Lorenz’s experiments in the 1960s, which led serendipitously to development of chaos theory (aka “butterfly effect). What Lorenz found – to his complete surprise – was that forecasts run with identically the same (simplistic) weather forecast model diverged from one another as forecast length increased solely due to even minute differences inadvertently introduced into the starting analyses (“initial conditions”). ..

……