“Climate has not changed.
We have changed.
Our habits have changed.
Our habits have got spoiled.”
Narendra Modi, India Today, 5th September 2014
“Climate has not changed.
We have changed.
Our habits have changed.
Our habits have got spoiled.”
Narendra Modi, India Today, 5th September 2014
The Australian Bureau of Meteorology (BOM) is scrabbling trying to defend why the intentional corruption of data is justified. Dr. Jennifer Marohasy has a new post demonstrating that the excuses being offered do not hold up.
Whereas the Australian establishment uses “homogenisation” as their euphemism for “intentional data corruption”, the US uses “adjustment” : How NOAA Data Tampering Destroys Science
Of course raw data often needs to be adjusted but when the magnitude of the data adjustment is greater than the magnitude of the conclusion, then the adjustments or homogenisation become “data corruption” or ” data tampering”. As my Professor, Doug Elliott, once told me – some 40 years ago – when I wanted to make calculated corrections for presumed errors due to radiation in flame temperature measurements, “You can argue for whatever corrections you want to make, but you cannot replace the measurement. The measurement is the measurement is the measurement”.
A “science” built on the falsification of data?
As was recently pointed out, fudging both data and model results seems endemic in “climate science”:
a recent paper from ETH Zurich.
If the model data is corrected downwards, as suggested by the ETH researchers, and
the measurement data is corrected upwards, as suggested by the British and Canadian researchers,
then the model and actual observations are very similar.
Reblogged from jennifermarohasy.com.
It really needs little comment, except perhaps that the magnitude of “homogenisation” or “adjustments”, or “corrections” as applied to the temperature record makes up most of the “global warming” that is claimed.
Homogenisation in Australia, Adjustments in the US. Fancy algorithms to “correct” data, with not a little confirmation bias, could be better described as “fudging”.
Heat is on over weather bureau ‘homogenising temperature records’
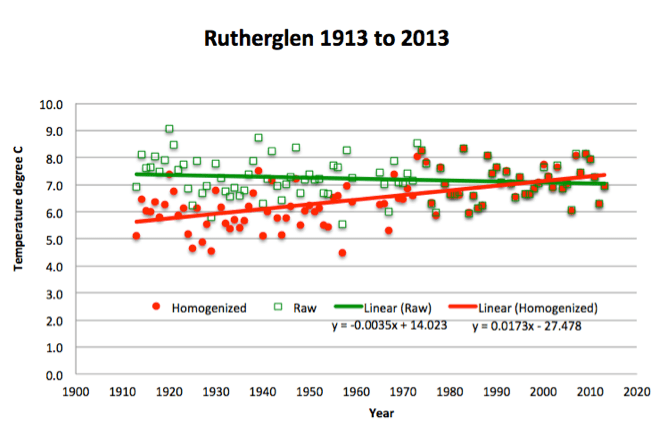
EARLIER this year Tim Flannery said “the pause” in global warming was a myth, leading medical scientists called for stronger action on climate change, and the Australian Bureau of Meteorology declared 2013 the hottest year on record. All of this was reported without any discussion of the actual temperature data. It has been assumed that there is basically one temperature series and that it’s genuine.But I’m hoping that after today, with both a feature (page 20) and a news piece (page 9) in The Weekend Australia things have changed forever. I’m hoping that next time Professor Flannery is interviewed he will be asked by journalists which data series he is relying on: the actual recorded temperatures or the homogenized remodeled series. Because as many skeptics have known for a long time, and as Graham Lloyd reports today for News Ltd, for any one site across this wide-brown land Australia, while the raw data may show a pause, or even cooling, the truncated and homogenized data often shows dramatic warming.
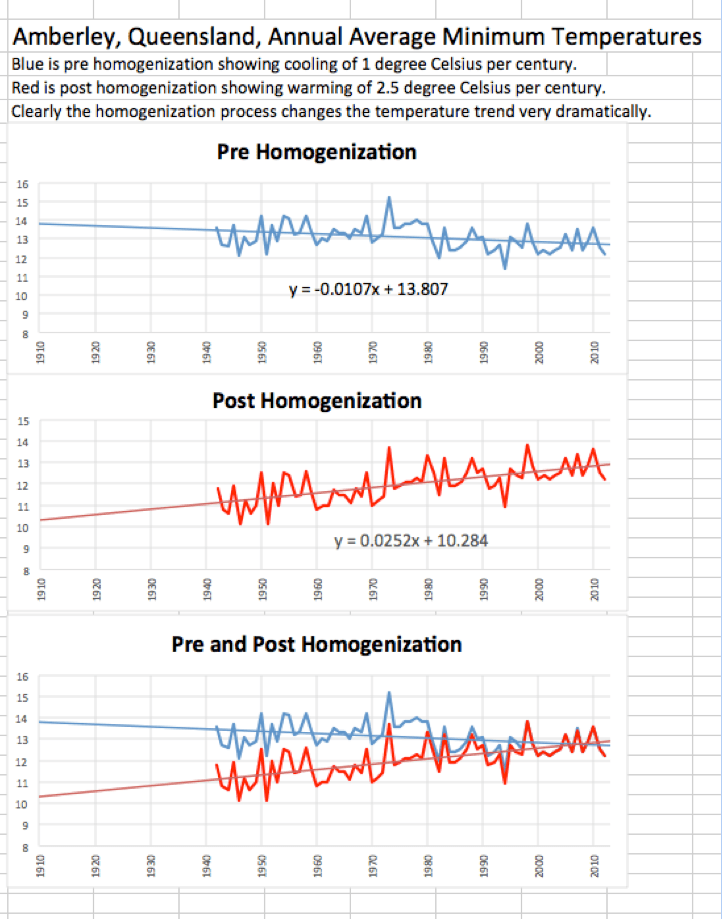
When I first sent Graham Lloyd some examples of the remodeling of the temperature series I think he may have been somewhat skeptical. I know he on-forwarded this information to the Bureau for comment, including three charts showing the homogenization of the minimum temperature series for Amberley.
Mr Lloyd is the Environment Editor for The Australian newspaper and he may have been concerned I got the numbers wrong. He sought comment and clarification from the Bureau, not just for Amberley but also for my numbers pertaining to Rutherglen and Bourke.
I understand that by way of response to Mr Lloyd, the Bureau has not disputed these calculations.
This is significant. The Bureau now admits that it changes the temperature series and quite dramatically through the process of homogenisation.
I repeat the Bureau has not disputed the figures. The Bureau admits that the data is remodelled.
What the Bureau has done, however, is try and justify the changes. In particular, for Amberley the Bureau is claiming to Mr Lloyd that there is very little available documentation for Amberley before 1990 and that information before this time may be “classified”: as in top secret. That’s right, there is apparently a reason for jumping-up the minimum temperatures for Amberley but it just can’t provide Mr Lloyd with the supporting meta-data at this point in time.
*****
The two articles in The Australian are behind a pay wall here and here. If you don’t already have a subscription to The Australian take one out today, because the articles are important and Graham Lloyd’s work is worth paying for.
So much for global warming being settled and the infallibility of incomplete and inadequate climate models.
Climate models generally take the effect of wildfires (brown carbon) on climate to be zero (it is not a parameter that is normally included). Both black and brown carbon particulates are products of incomplete combustion.
A new paper reports on experiments with the combustion of biomass and the brown carbon particulate matter in the smoke:
Saleh et al, Brownness of organics in aerosols from biomass burning linked to their black carbon content. Nature Geoscience (2014) doi:10.1038/ngeo2220
The research provides information which can now be included in climate models but since it is a parameter which is not usually included, the obvious conclusion is that for any given level of warming some other effect (most likely that of man-made emissions of carbon dioxide) has been overestimated in the models.
But it is not the obvious conclusion that makes the headlines. Instead it is the ridiculous and alarmist statement that “Forest fires can heat the climate“ that is the headline that Swedish Radio (which is about as orthodox as they come) chooses to lead with. They would clearly like to project the picture of a greater threat and not that of inadequate climate models.
Abstract: …. Here we present smog chamber experiments to characterize the effective absorptivity of organic aerosol from biomass burning under a range of conditions. We show that brown carbon in emissions from biomass burning is associated mostly with organic compounds of extremely low volatility. In addition, we find that the effective absorptivity of organic aerosol in biomass burning emissions can be parameterized as a function of the ratio of black carbon to organic aerosol, indicating that aerosol absorptivity depends largely on burn conditions, not fuel type. We conclude that brown carbon from biomass burning can be an important factor in aerosol radiative forcing.
The paper claims that brown carbon is a significant factor which must be taken into account and the more significant it is the less significant is man-made carbon dioxide.
It would now seem to be confirmed that US temperature data are being “adjusted” to meet the requirements of the adjusters.
This is more than confirmation bias. It is the fabrication of data.
I have posted this graph dozens of times, and hopefully this time it will be clear to everyone. The graph shows the average final temperature for all USHCN stations minus the average raw temperature for all USHCN stations. This is a very simple calculation which shows the average adjustment for all USHCN stations.
It shouldn’t be a surprise to NOAA or anybody else that an exponential increase in adjustments is occurring, as I have been showing the same graph (crying wolf) for many years.
USHCN adjustments – Real Science
While Real Science has been claiming this fabrication of data for some time it is only recently that it has started receiving serious attention. And it would seem that there are no real temperatures any more across the continental US. Where measuring stations no longer exist, temperatures are just made up for the purpose of “continuity”.
Paul Homewood has been looking at these and he posted this about the temperature adjustments at Kansas stations
Following much recent discussion on USHCN temperature adjustments, I have had a chance to analyse what has been going across the state of Kansas.
Altogether there are 30 USHCN stations, currently listed as operational in Kansas, and I have compared the mean temperatures from the USHCN Final dataset for January 2013, with the actual station measurements as listed in the State Climatological Reports. (There is one station at Lawrence, which I have excluded as the file seems to be corrupted). …..
- Nearly every station has had the actual temperatures adjusted upwards by about half a degree centigrade.
- There are 8, out of the 29 stations, which have “Estimated” temperatures on USHCN. This is a ratio of 28%, which seems to tie in with Steve Goddard’s country-wide assessment.
- Of these eight estimates, five are because of missing data, as listed at the bottom. Four of these are now shut.
- There seems to be no obvious reason why the other three estimates have been made , at Ellsworth, Liberal and Ottawa. The adjustments at these though don’t appear to be significantly different to the non estimated ones.
In addition to recent temperatures being adjusted upwards, we also find that historical ones have been adjusted down. So, for instance we find that the January 1934 mean temperature at Ashland has been adjusted from 3.78C to 3.10C, whilst at Columbus there is a reduction from 4.00C to 3.52C.
In total, therefore, there has been a warming trend of about 1C added since 1934. It has always been my understanding that the various adjustments made for TOBS, etc, have been made to the historic data, and that present temperatures were left unaltered. Certainly, the cooling adjustments of about half a degree in the 1930’s would seem to tally with what NOAA have been publishing.
But this leaves the question of just why there is a need to continually adjust current temperatures upwards.
What is going on is that the USHCN code is that while the RAW data file has the actual measurements, for some reason the final data they publish doesn’t get the memo that good data is actually present for these stations, so it “infills” it with estimated data using data from surrounding stations. It’s a bug, a big one. And as Zeke did a cursory analysis Thursday night, he discovered it was systemic to the entire record, and up to 10% of stations have “estimated” data spanning over a century. ……… And here is the real kicker, “Zombie weather stations” exist in the USHCN final data set that are still generating data, even though they have been closed. ……
There are quite a few “zombie weather stations” in the USHCN final dataset, possibly up to 25% out of the 1218 that is the total number of stations. In my conversations with NCDC on Friday, I’m told these were kept in and “reporting” as a policy decision to provide a “continuity” of data for scientific purposes. While there “might” be some justification for that sort of thinking, few people know about it there’s no disclaimer or caveat in the USHCN FTP folder at NCDC or in the readme file that describes this, they “hint” at it saying:
“The composition of the network remains unchanged at 1218 stations”
But that really isn’t true, as some USHCN stations out of the 1218 have been closed and are no longer reporting real data, but instead are reporting estimated data.
This is the fabrication of data – institutionalised – to satisfy a pre-determined conclusion.
The BP Statistical Review of World Energy 2014 is now out and the consumption of all fossil fuels has never been higher. Coal and gas consumption are particularly strong. And – even though many are in a state of denial about it – global warming has come to a stop over the last 18 years. In the last 10 years global temperatures show a slight downward trend.
There seems to be no purpose to the demonisation of fossil fuels other than for pandering to the religion of global warming. Consider the last 25 years. (I use 1988 as a reference point not only because 25 years should be enough to see some trends but also because the BP data is readily available from that date). During this 25 year period gas consumption has increased by over 80%, coal consumption by 0ver 70% and oil consumption by over 30%. The increased global coal burn since about 1999 is particularly striking. In the same 25 year period the carbon dioxide concentration in the atmosphere has increased from about 355 ppm(v/v) to about 395 ppm(v/v) – a rise of about 11%. And global temperatures have not increased at all for almost 2 decades.
Climate policy is policy without any objectives and without any means of checking any achievements. What exactly could we achieve by not using fossil fuels?
There is not a single climate policy proposed by the IPCC or by any government in the world which has a definable and measurable climate benefit.
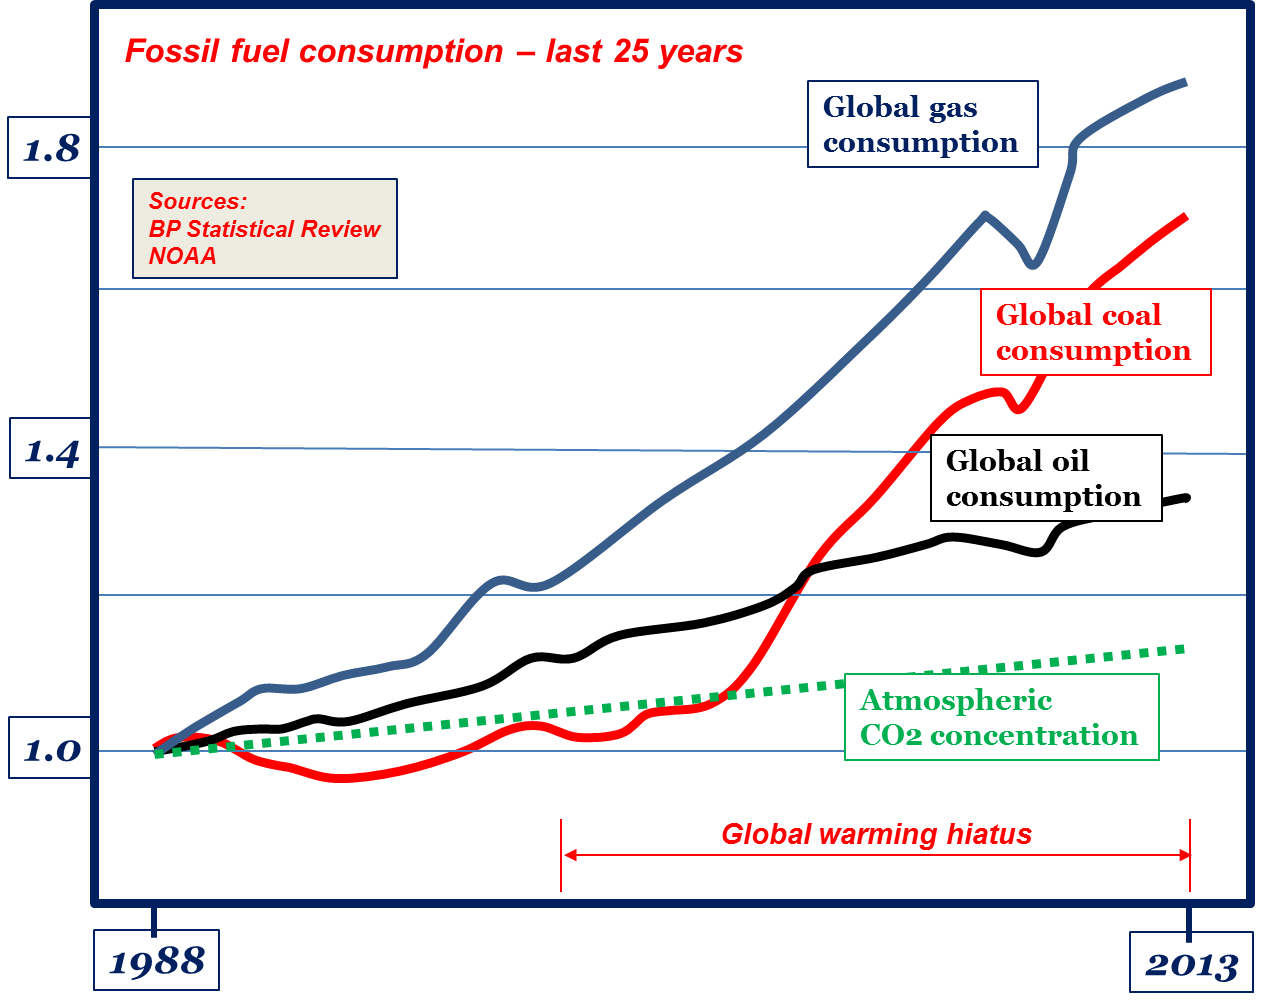
25 years of fossil fuel consumption
The global warming hiatus now extends to at least 18 years.
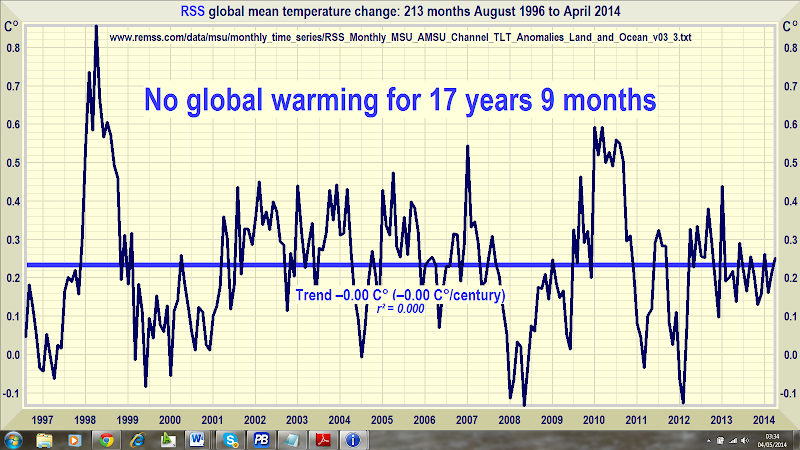
Global warming has gone missing
- The RSS satellite dataset shows no global warming at all for 213 months from August 1996 to April 2014. That is more than half the entire 423-month satellite record.
- The fastest centennial warming rate was in Central England from 1663-1762, at 0.9 Cº per century – before the industrial revolution began. It cannot have been our fault.
- The global warming trend since 1900 is equivalent to 0.8 Cº per century. This is well within natural variability and may not have much to do with us.
Man is the culprit. Development is Evil.
Humanity is doomed if we don’t stop burning fossil fuels.
How so?
We are emitting so much carbon dioxide by burning coal and oil and gas that the CO2 in our atmosphere is increasing. CO2 is a “greenhouse gas” and this is causing the earth to heat up by about 0.8ºC in the last 100 years and – according to our computer models – by between 2-5ºC by 2100. The ice at the poles will melt and sea level will rise and the billions will drown. There will be more wars in all that heat and millions more will die. There will be wars over water and more millions will die. Displaced people will crowd into ever smaller areas and there will be more conflict and more will die. Humanity is doomed!
Oh! But you know the greatest temperature difference I experience is almost 50ºC between summer and winter and that is surely due to the earth’s tilt and the sun. The greatest temperature difference I experience in a day of around 10- 20ºC is between day and night and that is due to the earth’s daily spin. The greatest temperature difference I experience during daytime is around 10ºC and due to clouds. So how do you know that this 0.8ºC rise in the last 100 years has been caused primarily by the CO2 in the atmosphere?
Well we don’t – not for sure. But what else could it be? Our computer models have taken all parameters into account and it has to be CO2. There is nothing else. Physics tells us that CO2’s greenhouse properties are real. It blocks outgoing radiation from the earth. 97% of my friends agree with me. Al Gore agrees with me. Barack Obama agrees with me.
But what about clouds then? They block both incoming and outgoing radiation. Aren’t they the controlling factor?
True but in our models it is the CO2 which also drives the clouds (though we don’t know if the net effect of clouds is warming or cooling). Anyway, CO2 causes a change in clouds such that its own warming effect is amplified. The forcing causes Global Warming.
Are you sure it is man-made CO2 which is increasing the CO2 in the atmosphere? After all man-made CO2 only accounts for about 4% of all CO2 emissions.
Well everything else was in equilibrium. And about 40% of man-made CO2 – we think – goes to increasing the atmospheric content of CO2.
For the last 20 years CO2 has been increasing but global temperature has not. So CO2 in the atmosphere cannot possibly be driving temperature?
Twenty years is too short a time to draw that conclusion. The Earth is still warming but the heat is hidden in the oceans.
But the oceans have not warmed either?
The heat is hiding in the deep ocean where we cannot make measurements. It is waiting for a sudden and catastrophic release.
So, at least for twenty years Global Warming has stopped even though CO2 has been increasing. Why then reduce fossil fuel combustion?
In any case Global Warming is not really the problem – Climate Change is. And CO2 is causing Climate Change. Even if the Global warming is invisible. More storms, more ice melting more All manner of Bad things. Death. Man is Evil.
All the weather we have observed in the industrial age has been observed before? What is unusual? Lately even storms have decreased.
The Frequency of Bad Weather is increasing. And it will get worrse. It’s all due to man-made CO2.
The Climate Change we have seen in the last 100 years has varied from warming to cooling roughly every 30 – 40 years. Maybe all that we see is just Natural Climate Change.What if the climate is now cooling?
That too is obviously due to CO2. We can make our mathematical models to show that as well. It just requires different forcings to be applied. In any case Cooling is also Climate Change. And Climate Change is Bad. And it is caused by burning fossil fuels.
So man should strive to keep Climate unchanging?
Of course not. Man should strive to reduce his impact and let Climate Change be Natural.
So, Natural Climate Change is Good but Man-made Climate Change is Bad
Of course.
But do you know what causes Natural Climate Change?
It’s the Sun stupid.
So a Natural drought with starvation or the destruction by a Natural Hurricane is a Good thing?
It will happen more often if man interferes.
What when the Sun – as the prime source of Energy – causes a new Ice Age? When the next Ice Age comes, shouldn’t we try to influence the climate? To create some Global Warming?
Man is Evil and Man-made Climate Change is Evil and You are Evil. My peer-reviewed, IPCC endorsed mathematical model proves it conclusively.
Thank You.
There is much wailing and gnashing of teeth.
The headlines would suggest an impending catastrophe. The Western Atlantic ice sheet is “collapsing”. Sea level could rise 1.2m.
The end of the world is nigh. And it is all due to global warming!!
Yes indeed – except that the melting has been going on for centuries. The so called “collapse” may take upto 1,000 years! Measurements over 9 years are projected over a millenium. Computer models have forecast that the loss of the glaciers is unstoppable and will occur sometime in the next 1,000 years.
The Guardian: Western Antarctic ice sheet collapse has already begun, scientists warn
BBC: ‘Nothing can stop retreat’ of West Antarctic glaciers
A collapse in very slow motion!
The alarmist headlines are are based on two papers. Note that one is based on 9 years of measurement and the other is a computer forecast about a “collapse” that is potentially underway.
1. E. Rignot, J. Mouginot, M. Morlighem, H. Seroussi and B. Scheuchl, Widespread, rapid grounding line retreat of Pine Island, Thwaites, Smith and Kohler glaciers, West Antarctica from 1992 to 2011, Geophysical Research Letters, DOI: 10.1002/2014GL060140
Abstract: We measure the grounding line retreat of glaciers draining the Amundsen Sea Embayment of West Antarctica using Earth Remote Sensing (ERS-1/2) satellite radar interferometry from 1992 to 2011. Pine Island Glacier retreated 31 km at its center, with most retreat in 2005–2009 when the glacier un-grounded from its ice plain. Thwaites Glacier retreated 14 km along its fast-flow core and 1 to 9 km along the sides. Haynes Glacier retreated 10 km along its flanks. Smith/Kohler glaciers retreated the most, 35 km along its ice plain, and its ice shelf pinning points are vanishing. These rapid retreats proceed along regions of retrograde bed elevation mapped at a high spatial resolution using a mass conservation technique (MC) that removes residual ambiguities from prior mappings. Upstream of the 2011 grounding line positions, we find no major bed obstacle that would prevent the glaciers from further retreat and draw down the entire basin.
2. Ian Joughin, Benjamin E. Smith and Brooke Medley, Marine Ice Sheet Collapse Potentially Underway for the Thwaites Glacier Basin, West Antarctica, Science, DOI: 10.1126/science.1249055
Abstract: Resting atop a deep marine basin, the West Antarctic Ice Sheet has long been considered prone to instability. Using a numerical model, we investigate the sensitivity of Thwaites Glacier to ocean melt and whether unstable retreat is already underway. Our model reproduces observed losses when forced with ocean melt comparable to estimates. Simulated losses are moderate (<0.25 mm per year sea level) over the 21st Century, but generally increase thereafter. Except possibly for the lowest-melt scenario, the simulations indicate early-stage collapse has begun. Less certain is the timescale, with onset of rapid (> 1 mm per year of sea-level rise) collapse for the different simulations within the range of two to nine centuries.
The Antarctic glaciers may well be retreating (as glaciers are often wont to do), but Antarctic ice cover is at an all time high and the processes being forecast are being projected over millenia. And there is absolutely no evidence that these processes have anything whatever to do with any man-made effects. That connection is inferred or assumed.
Related: The Guardian’s Suzanne Goldenberg jumps the shark again – gets called out by NYT
Why climate change is “bad” when nobody really knows what static climate is to be desired, and where climate stagnation would mean that the earth was dead, escapes me.
Taking pot shots at The Guardian on climate change is not very intellectually challenging, but sometimes the temptation cannot be resisted.
June 2011: Britain’s hot spring could be result of shrinking Arctic
March 2013: Scientists link frozen spring to dramatic Arctic sea ice loss
The first article was written by Robin Mckie, “Science Editor” and the second by John Vidal, “Environment Editor”. Which leads to the inevitable conclusion that for The Guardian, “hot” may be synonymous with “cold” but “environment” and “science” have entirely different values.


A return to coal as reality bites. It is now a “good thing” to help Eastern Europe to shift from Russian gas to their own coal.
Perhaps it is beginning to sink in that while carbon dioxide emissions have increased substantially in the last 20 years there has been no impact on global temperature. There is just no direct evidence that man-made carbon dioxide emissions have any significant impact on global temperature or on climate. The entire edifice of climate politics is built on this one unproven – and now broken – assumption. Take away this single assumption and all of climate politics collapses in a sorry heap.
The government plans to support Ukraine and other Eastern European nations in the construction of next-generation coal-fired power plants that can generate power with less fuel, according to informed sources.
Under the initiative, Japan would stand behind the nations’ efforts to use coal—abundant in Eastern Europe—instead of natural gas, the supply of which makes them dependent on Russia. The government is expected to announce the initiative at the meeting of energy ministers from Japan and other Group of Seven industrialized nations to be held in Rome from May 5.
Japan’s support will involve the construction of coal-fired power plants using technologies known as supercritical steam pressure and ultra supercritical pressure to spin the turbines, enabling these nations to obtain electricity while using less fuel and emitting less carbon dioxide.
With a power generation efficiency of 40 percent to 43 percent, Japan has the world’s most advanced technologies in this field. About one-fourth of the coal-fired power plants in the nation use these technologies.
In comparison, Germany has a power generation efficiency of about 38 percent, while the corresponding figures for Ukraine and other Eastern European nations apparently remain at the 30 percent levels.
If an agreement is reached with Ukraine, Japan will support a feasibility study to rebuild power plants during the current fiscal year. Under the initiative, Japan will provide yen loans to cover several tens of billions of yen in construction costs in addition to its energy-saving technologies, while Ukraine will provide emission quotas for greenhouse gases to Japan under their bilateral framework.
The G-7 meeting of energy ministers will discuss policies to raise the energy self-sufficiency rates of Ukraine and other European nations, as well as diversifying their energy supplies with one goal in mind: lowering their dependency on natural gas and oil from Russia.
Ukraine imports 60 percent of the natural gas it uses from Russia, while the three Baltic nations and Eastern European nations buy from 60 percent to 100 percent of their natural gas from that country—a situation that makes it difficult to shift away from their reliance on Russia.
Though they have a dearth of natural gas, Eastern European nations have rich reserves of coal, with Ukraine being almost self-sufficient in that resource. Introduction of the next-generation coal-fired power plants is likely to improve their energy self-sufficiency rates, the sources said.

