The “design life” of a component or system is generally a boundary condition before starting to design. It is an inherent part of the design. The human body can be taken to be a system based on the organs as major components and a myriad of other components. Our genes are the design for our bodies and they exhibit a “design life”. Whatever we may assign as the purpose of our DNA, our bodies exhibit a design life of between 50 and 60 years.
In engineering, when an artefact or component or system is created, it is quite usual to have a “design life” as one of the key boundary conditions for designing the artefact. The artefact-lifetime to be designed for determines the choice of materials for strength and resistance to corrosion and erosion, and for their cycling properties and their resistance to fatigue and creep. The lifetime to be designed for leads to a choice for the level of redundancies to be included, the ease of maintenance to be allowed for and a choice of a maintenance strategy which includes a replacement “philosophy”. The “design life” is then usually defined as the time for which the artefact will be fully functional and can often be the lifetime guaranteed by the manufacturer. The designer makes his choices based on the probability of failures. For example the quoted design-life may be based on the time when the probability of failure or loss of functionality is – say – less than 10% or 1% or 0.1%.
The concept of “design-life” is different to the concept of “obsolescence” or the “mean time between failures” (MTBF). Obsolescence, whether introduced intentionally or not, is the time when when the defined functionality is no longer relevant. It could be intentionally “built-in” as a marketing strategy or it may result from the appearance of new technologies. The MTBF is a measure of the time between random – not due to wear – failures of a particular component. The MTBF of single components will generally be orders of magnitude longer than the design-life of that component.
Most components or systems can – with proper maintenance – be used with full functionality long beyond their quoted design life. A power plant may have a design life of 25 years, guarantees for only 2 years but may be used for 50 or 60 years. A digital camera may have a design life of 5 years but could be obsolete after just three. A Swatch may have a design-life of 5 years and materials to suit, whereas a Rolex may use materials and manufacturing quality to be able to come with a lifetime guarantee (with suitable caveats for the user’s negligence). When analysing reliability, the life of components and systems is often illustrated by the generic “bathtub curve”, where the total failure rate is given by the addition of random failures, failures due to “infancy problems” and failures due to wear. Infancy issues are those which are caused by quality of materials, manufacturing tolerances, manufacturing processes and the like.

On the bathtub curve the design life used to create a design will always fall within the section where the total failure rate is at its lowest – that is after the initial period where “teething” and other infancy problems arise and before the sharp increase in failure due to wear. Generally, to change the design life the basic design itself must be changed.
Consider the human body as a system where the organs are the key components making up the system. The functionality of human organs and of different human functional abilities also exhibit a form very similar to a reversed “bathtub” curve. Failure of a human body occurs when one or more of the functionalities falls below some threshold minimum. In the diagram below, the shaded area represents the behaviour of most organs with age. The lines represent the variation of some of the complex human functional abilities with age.
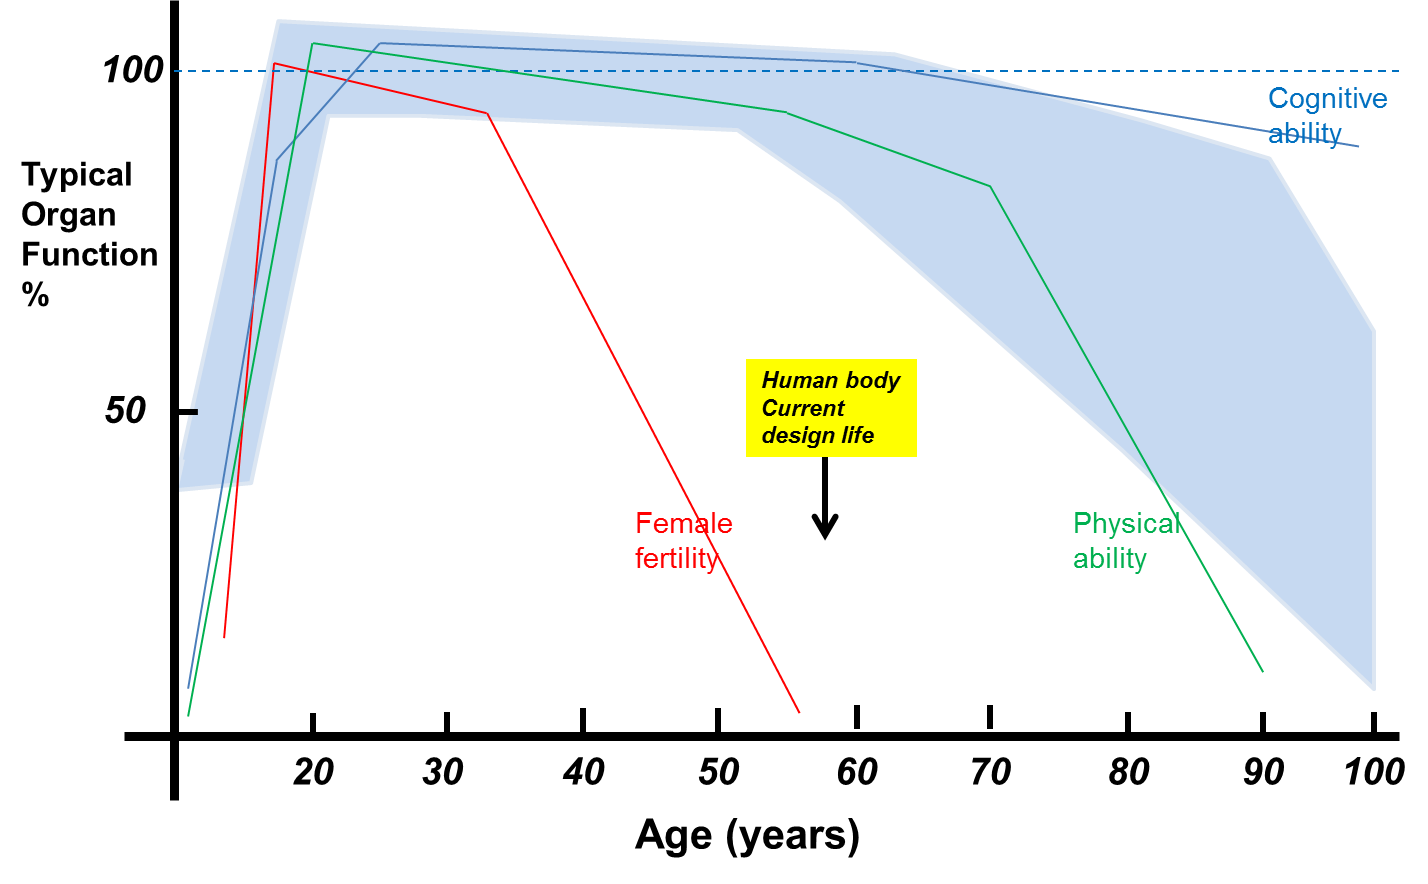
Functionality of organs with age
The reverse bathtub curve suggests that the human body has a design life of between 50 and 60 years.
“Infancy problems” in this context include birth and genetic defects which can influence the development and failure rate of organs. “Wear” would be the physical and mental wear and tear but would now also include the effects of aging which curtail the replacement of cells. Average, global, life expectancy is now around 80 years and the longest verified age is about 122 years. Average life expectancy has increased over the last 200 years at the rate of about 3 months every year. Over the next 100 years this may level off to perhaps add another 20 years to life expectancy. Already in 2012 the UN estimated that there were more than 300,000 centenarians alive. By 2100 perhaps global life expectancy would have reached 100 years and the maximum age attained may then be around 140-150 years.
Using the engineering analogy, the main advances in life expectancy have so far come due to improving maintenance and replacement processes but have not improved on the “basic design”. The “improved quality” at birth and in infancy and medical advances have meant that “maintenance” processes have improved drastically. Modern health care is to a large extent the application of “preventive maintenance”.
But, the the basic design is unchanged. The materials used in making up the human body have not changed but “maintenance and repair” strategies have improved out of all recognition. The life of our various organs have not changed inherently, except as a result of the much improved maintenance regime. With no change in basic design, the design life has not changed either. The increasing lifetime of the system (the body) is now beginning to approach the lifetime of the components (the organs) it is made up of.
Currently the design life of a human body could be said to be about 50-60 years. Studies suggest that though we live longer we also have longer periods at the end of our lives when our functionality is severely impaired. The ” basic design” has not changed and the “design life” is not increasing. Life spans of 200 years will not be possible without some change in the “basic design”. For our design life to change it will need advances which allow our cells to keep replicating without the aging effects of the shortening of the telomeres. When that happens (not if), then we would effectively have altered the “basic design” of the human body and its design life.

