Archive for the ‘Climate’ Category

Peter Ziegler RIP

July 29, 2013
PAZiegler s.jpg

Prof. Peter A Ziegler

Professor Peter Ziegler passed away a few days ago aged 84.

RIP

Prof. Peter Ziegler (1928 – 2013) was a Swiss geologist  and Titular Professor of Global Geology at the Geological-Paleontological Institute, University of Basel. He is a member of the Royal Netherlands Academy of Sciences, the Polish Academy of Arts and Sciences, the Russian Academy of Natural Sciences and the Academia Europaea.

I posted in March about his presentation on the “Mechanisms of Climate Change” from February this year.

Climate Change Ziegler 2013 (pdf)

Earthquakes release methane from methane hydrates

July 29, 2013

“Natural” release of methane from methane hydrates by earthquakes is more common and more significant than has been thought or accounted for in climate models.

The inescapable conclusion is that effects  being attributed by the demonisation of carbon to man made carbon dioxide emissions (even if real) may well be partly due to the natural release of such methane.  The global temperature pause for the last 17 years or so and the clear but small decline in global temperatures for the last 5 years is quite clear. At the same time emissions from fossil fuel combustion have been steadily increasing. These are a clear indication that the supposed linkage between carbon dioxide concentration and man-made carbon dioxide emissions on climate is very suspect if not completely broken.

It is also becoming increasingly clear that climate models – even though very complicated – are far too simplistic and just don’t (can’t) take all factors into account. Clouds, aerosols, particulates, solar effects, lunar cycle effects through the tides, ocean cycles and now earthquakes are all poorly understood and largely ignored in climate models. There is far more in the realms of the unknown about the climate than is known. We don’t even know what we don’t know.

David Fischer, José M. Mogollón, Michael Strasser, Thomas Pape, Gerhard Bohrmann, Noemi Fekete, Volkhard Spiess & Sabine Kasten, Subduction zone earthquake as potential trigger of submarine hydrocarbon seepage, Nature Geoscience (2013) doi:10.1038/ngeo1886

Here we present geochemical analyses of sediment cores retrieved from the convergent margin off Pakistan. We find that a substantial increase in the upward flux of gas occurred within a few decades of a Mw 8.1 earthquake in 1945—the strongest earthquake reported for the Arabian Sea. Our seismic reflection data suggest that co-seismic shaking fractured gas-hydrate-bearing sediments, creating pathways for the free gas to migrate from a shallow reservoir within the gas hydrate stability zone into the water column. We conservatively estimate that 3.26×10⁸ mol of methane have been discharged from the seep site since the earthquake. We therefore suggest that hydrocarbon seepage triggered by earthquakes needs to be considered in local and global carbon budgets at active continental margins.

New York Times:

Dr. Fischer and his colleagues analyzed sediment cores taken in 2007 from two locations in the northern Arabian Sea where hydrates were present and seepage was occurring. They found chemical signatures in the cores suggesting that the methane flow greatly increased sometime in the mid-20th century. Looking through seismic records, Dr. Fischer found that a magnitude 8.1 quake occurred in the area in 1945. The quake, which was centered less than 15 miles from where the cores were taken, and a resulting tsunami, killed up to 4,000 people.

The conclusion was inescapable, Dr. Fischer said. “The quake broke open gas-hydrate sediments and the free gas underneath migrated to the surface.” The hydrates themselves did not dissolve. “They remain there,” he said.

Dr. Fischer said the researchers chose the core locations in the Arabian Sea because they wanted to get a better understanding of how methane seepage was related to tectonics, and the area is in an active zone where one of the earth’s tectonic plates slides beneath another. But they were not thinking about the effect of individual earthquakes, and his discovery of the 1945 quake in the records “was probably a moment I’ll never forget,” he said.

The upward flow of methane is continuing today, and the researchers do not know when it might stop. All told, they estimate that nearly 10 million cubic yards of methane have been released from the core sites over the years. But that is a conservative figure, Dr. Fischer said, because immediately following the quake the flow would have been much higher.


The lunar nodal cycle and its effects on climate

July 27, 2013

A paper has just been published in the International Journal of Climatology showing that the lunar nodal cycle influences “the low-frequency summer rainfall variability over the plains to the east of subtropical Andes, in South America, through long-term sea surface temperature (SST) variations induced by the nodal amplitude of diurnal tides over southwestern South Atlantic (SWSA).”

Eduardo Andres Agosta, The 18.6-year nodal tidal cycle and the bi-decadal precipitation oscillation over the plains to the east of subtropical Andes, South America, International J of Climatology, DOI: 10.1002/joc.3787

Abstract: This work shows statistical evidence for lunar nodal cycle influence on the low-frequency summer rainfall variability over the plains to the east of subtropical Andes, in South America, through long-term sea surface temperature (SST) variations induced by the nodal amplitude of diurnal tides over southwestern South Atlantic (SWSA). In years of strong (weak) diurnal tides, tide-induced diapycnal mixing makes SST cooler (warmer) together with low (high) air pressures in the surroundings of the Malvinas/Falklands Islands in the SWSA, possibly through mean tropospheric baroclinicity variations. As the low-level tropospheric circulation anomalies directly affect the interannual summer rainfall variability, such an influence can be extended to the bi-decadal variability present in the summer rainfall owing to the nodal modulation effect observed in the tropospheric circulation. The identification of the nodal periodicity in the summer rainfall variability is statistically robust.

The lunar nodal cycle is not something that is very well known but it is another celestial cycle which is clearly not to be ignored. Naturally the IPCC takes no notice of solar cycles, planetary cycles or lunar cycles and all these are lumped into what could be considered “natural variability”.

(Sourced from Wikipedia)

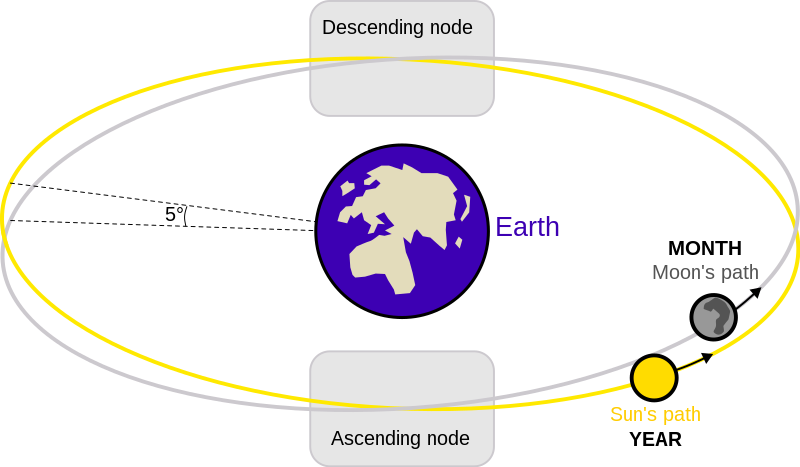
The lunar orbit is inclined by about 5 degrees on the ecliptic. The moon  therefore can lie up to about 5 degrees north or south of the ecliptic. The ecliptic is the plane of the apparent path of the Sun on the celestial sphere, and is coplanar with both the orbit of the Earth around the Sun and the apparent orbit of the Sun around the Earth.

File:Lunar eclipse diagram-en.svg

Lunar eclipse orbital diagram: wikipedia

The lunar nodes precess around the ecliptic, completing a revolution (called a draconitic or nodical period, the period of nutation) in 6793.5 days or 18.5996 years.

The effects of the 18.6 year lunar nodal cycle on climate on tides and geological sediments and on weather and climate have long been of interest (though not apparently for the IPCC).

Nanocycles Method is the English translation of the title of a book published in Russian by Professor of Geology S Afanasiev of Moscow University in 1991,ISBN 5–7045–0109–0.

From “Nanocycles Method” by S Afanasiev, 1991

The lunar node cycle, which is presently 18.6 years, affects the rainfall on a 9.3 year cycle and this shows up as varying thickness layers of deposits, or varves, in geological formations. 

However the moon’s orbit is gradually getting larger over time and so its period is slowing down. The rate of movement of the nodes is also decelerating and Prof Afanasiev has determined the accurate nodal cycle period for the whole of the last 600 million years.

The cycle of the lunar node is important in affecting the weather because it plays a part in determining tides in the atmosphere, oceans and solid body of the earth. The atmospheric tides affect rainfall which in turn affects river flows and hence the deposition of geological varves, or annual deposits in geological layers. ….. 

At the present time, with a nodal cycle of 9.3 years, successive nodal cycles begin 0.3 years later in the seasons each cycle. Therefore after 3 or 4 cycles the nodal cycle start return to the same time of year again. The average period of the cycle when the nodal cycle comes at the same time of year is 9.3/0.3 or 31 years. Specific occurrences of nearly the same season, within 0.1 year, will occur after 28, 65 and 93 years and so on. 

…. Because the lunar nodal cycle period has changed from 9.147 years to 9.298 years in the last 1.0 million years, the secondary cycle has varied from 62.12 years to 31.21 years. If this cycle can be measured in a deposit to an accuracy of 1 year then it allows the dating of the deposit to an accuracy of +/-0.03 million years.

A small selection of papers dealing with the effects of the 18.6 year lunar nodal cycle is given below:

Fun and games at the US Senate hearing on Global Warming

July 21, 2013

A US Senate hearing has just been held under the Chairmanship of Senator Barbara Boxer “to focus on Climate Change and the serious threat it poses to our nation”.

(As an aside – I wonder if the proponents of global warming are so nervous and uncertain about their own creed that they need to use “Climate Change” as a euphemism. If they mean “global warming” why don’t they just say “global warming”? Or could they be just preparing their own fall-back positions in case “global warming” turns out to be “global cooling”?).

But if the good Senator’s hope was that the case for global warming (aka Climate Change) was going to be established beyond all reasonable doubt then it seems the hearings have spectacularly backfired.

From WUWT:

Quite a performance yesterday. Steve Milloy is calling it the “Zapruder film” implying it was the day the AGW agenda got shot down. While that might not be a good choice of words, you have to admit they did a fantastic job of shooting down some of the ridiculous claims made by panelists prior to them. While this may not be a Zapruder moment, I’d say that it represented a major turning point.

…..

Video link and links to PDF of testimonies follow.

Here is the video link, in full HD:

http://www.senate.gov/isvp/?type=live&comm=epw&filename=epw071813

Dr. Spencer writes about his experience here and flips the title back at them:

http://www.drroyspencer.com/2013/07/senate-epw-hearing-climate-change-its-happened-before/

The PDF’s of each person’s testimony can be accessed by click on their names below:
Panel 1

Dr. Heidi Cullen
Chief Climatologist
Climate Central
Mr. Frank Nutter
President
Reinsurance Association of America
Mr. KC Golden
Policy Director
Climate Solutions
Ms. Diana Furchtgott-Roth
Senior Fellow
Manhattan Institute for Policy Research
Dr. Robert P. Murphy
Senior Economist
Institute for Energy Research

Panel 2

Dr. Jennifer Francis
Research Professor
Institute of Marine and Coastal Sciences, Rutgers University
Dr. Scott Doney
Director, Ocean and Climate Change Institute
Woods Hole Oceanographic Institution
Dr. Margaret Leinin
Executive Director, Harbor Branch Oceanographic Institute
Florida Atlantic University
Dr. Roger Pielke, Jr.
Professor, Center for Science and Technology Policy Research
University of Colorado
Dr. Roy Spencer
Principal Research Scientist IV
University of Alabama, Huntsville

Disaster looms! Sea level may rise 5 cm by 2100

July 5, 2013

Sea levels in the past have been 10 m higher than today and 150 m lower than today.

Alarmism will have us believe that +5 cm ±15 cm in sea level that may actually happen by 2100 will threaten the very existence of humanity!

A new paper from Nils-Axel Mörner.

SEA LEVEL CHANGES PAST RECORDS AND FUTURE EXPECTATIONS

by Nils-Axel Mörner

ABSTRACT The history and development of our understanding of sea level changes is reviewed. Sea level research is multi-facetted and calls for integrated studies of a large number of parameters. Well established records indicate a post-LIA (1850–1950) sea level rise of 11 cm. During the same period of time, the Earth’s rate of rotation experienced a slowing down (deceleration) equivalent to a sea level rise of about 10 cm. Sea level changes during the last 40-50 years are subjected to major controversies. The methodology applied and the views claimed by the IPCC are challenged. For the last 40-50 years strong observational facts indicate virtually stable sea level conditions. The Earth’s rate of rotation records a mean acceleration from 1972 to 2012, contradicting all claims of a rapid global sea level rise, and instead suggests stable, to slightly falling, sea levels. Best estimates for future sea level changes up to the year 2100 are in the range of +5 cm ±15 cm.

ENERGY & ENVIRONMENT, VOLUME 24 No. 3 & 4 2013

Further uncertainties in the Carbon cycle

July 4, 2013

The Carbon cycle is far from being fully understood or quantified. The absorption and release of carbon dioxide by the oceans and from biological plants and fungii – both on land and in the ocean – are a long way from being established. The amount of Carbon locked up in the earths crust is equally subject to great uncertainty.

A new paper shows that deep soils hold much higher levels of carbon than is usually assumed.

R. J. Harper, M. Tibbett, The hidden organic carbon in deep mineral soilsPlant and Soil, July 2013, Volume 368, Issue 1-2, pp 641-648

Abstract: Current estimates of soil organic carbon (SOC) are based largely on surficial measurements to depths of 0.3 to 1 m. Many of the world’s soils greatly exceed 1 m depth and there are numerous reports of biological activity to depths of many metres. Although SOC storage to depths of up to 8 m has been previously reported, the extent to which SOC is stored at deeper depths in soil profiles is currently unknown. This paper aims to provide the first detailed analysis of these previously unreported stores of SOC. ….. Mean SOC mass densities for each of the five locations varied from 21.8–37.5 kg C m−2, and were in toto two to five times greater than would be reported with sampling to a depth of 0.5 m.

PhysOrg reportsCurrent estimates of soil organic carbon are based largely on measurements to depths of 30 cm. This approach has evolved in North America and Europe, where soil is generally more shallow. 

However, many plant species have roots extending many metres deep, suggesting there is also carbon stored at such depth and inspiring researchers to explore the storage potential of deeper soils in older landscapes such as the Amazon or Australia. Researchers in the Amazon had previously sampled soils to 8 m. 

The researchers took soil measurements from samples taken to almost 40 metres deep at a range of sites in south-western Australia. They found that small amounts of carbon were present throughout the soils all the way to the bedrock, and that deep soils store up to five times more carbon than is normally reported.

Lead researcher Professor Richard Harper, an expert in water management and sustainability at Murdoch University said the findings extend our concept of the amounts and potential of carbon stored in soils.

“This carbon has been previously overlooked, and this opens up several lines of inquiry – for example, what happens to this carbon with land use change such as deforestation and reforestation?” Professor Harper said.

“There is likely more carbon stored in the world’s soils than previously considered. What will happen to this carbon – that is, will it be released as a result of either land-use change or climate change – is unknown. This is what we are working on now,” he said.


On constraining the quality of climate science

July 3, 2013

I wrote this – following the words of the Bard – about something else

The quality of intelligence is not strain’d,
It may not be shaped or created or invented
to suit a man’s convenience. It is twice cursed:
It curses him who invents and curses the fool who believes.

and then realised it could easily be adapted to fit “hockey stick” climate science

The quality of climate science is not strain’d,
It may not be shaped or tricked into a hockey stick
to suit a Mann’s convenience. It is twice cursed:
It curses him who tricks and curses the fools who believe.

Beware Global Cooling

July 1, 2013
File:Hendrick Avercamp - Frozen River with Skaters - Google Art Project.jpg

Hendrick Avercamp – Frozen River with Skaters

Andrew McKillop has a new article posted at The Market Oracle.

Global cooling began at the end of the so-called Medieval Warm Period, by or before the year 1300, and was preceded by at least 200 years, and as long as 350 years, of warming on the same variable and unpredictable basis. Measurement problems include the type of proxies used – ice cores, tree rings, corals and shells, others – but at least as important, the ideological bias of climate science leads to extreme variations in reconstructed climate data for the same region, same period. One flagrant example is IPCC treatment of Medieval Warming Period data – as published by the IPCC in different editions of its reports and studies. Before year 2000, IPCC studies include papers showing Warm Period temperatures in certain high latitude locations at certain dates around 950-1200 as several full degrees celsius above present day temperatures.

That is, despite 213 years of anthropogenic global warming if with the IPCC we use a start date of 1800 for human “carbon pollution of the atmosphere”, we have in no way matched this natural warming. Which needed zero assistance from human-source CO2.

This is the global cooling fear

Flooding in the low countries in Europe was a common feature which accompanied the global cooling which succeeded the Medieval Warm Period. The cooling period he writes, lasted 450 years.

(more…)

“Climate alarmism was a child born of good times”

June 30, 2013

Pointman has an interesting essay here:

….  Climate alarmism was, and could only have been, a child born of good times. In the midst of an extraordinarily long fifteen year economic boom when most people had jobs, money, houses and not many real concerns, it was something that a number of people actually needed to invent. The politicians needed a danger they could save us from and as it happened, a few scientists raised some genuine concerns over the slight temperature uptick that occurred in the closing decades of the previous century. The political activists of the well left of centre group, still reeling from the double whammy of the death of the liberal dream in the eighties and the collapse of Soviet communism in the nineties, needed it even more desperately. …. 

A few compliant third-rate scientists were catapulted blinking mole-like out of obscurity and up into that media firmament of stardom. Basking in their new-found adulation, they became masters of the climate universe. The media hung on every word they uttered, the politicians engaged them as climate advisers, big business paid them handsomely for the cachet of their time as consultants, little men suddenly became important little men and gradually, the details of the science not only became unquestioned but also unquestionable. …

A good read.


Global warming “hockey stick” is turning into a baseball bat

June 29, 2013

(A fun comment at CA is particularly apposite!

Posted Jun 28, 2013 at 5:18 PM 

@Steve McIntyre

From Fig. 4 above:

it’s quite obvious that in 2009 and again in 2011, you shamelessly plagiarised Briffa 2013

Easily the worst sin in the academic book, run a close second only by disrupting the space-time continuum in order to perform the plagiarism)

======================================================

Steve McIntyre’s objections to the Yamal tree (“the most important tree in the world”) in the global warming hockey stick are being vindicated as the new version of the data series resembles a baseball bat much more than a hockey stick.

Full story at Climate Audit and at WUWT

yamal_chronology_compare-to-b13