Archive for the ‘Climate’ Category

La Niña and NAO driving current stormy weather

February 8, 2011
During cold La Niña episodes the normal patter...

La Nina Regional impacts: Image via Wikipedia

It may seem obvious (or it should be) that it is ocean currents that dominate weather and man-made effects pale into insignificance in relation to these. But it has been more politically correct to find that every kind of weather event is due to man-made global warming.

But as this article in PhysOrg shows, perhaps the oceans (and the sun) are beginning to get their due (but of course they don’t really care whether anybody believes in them or not – they just carry on).

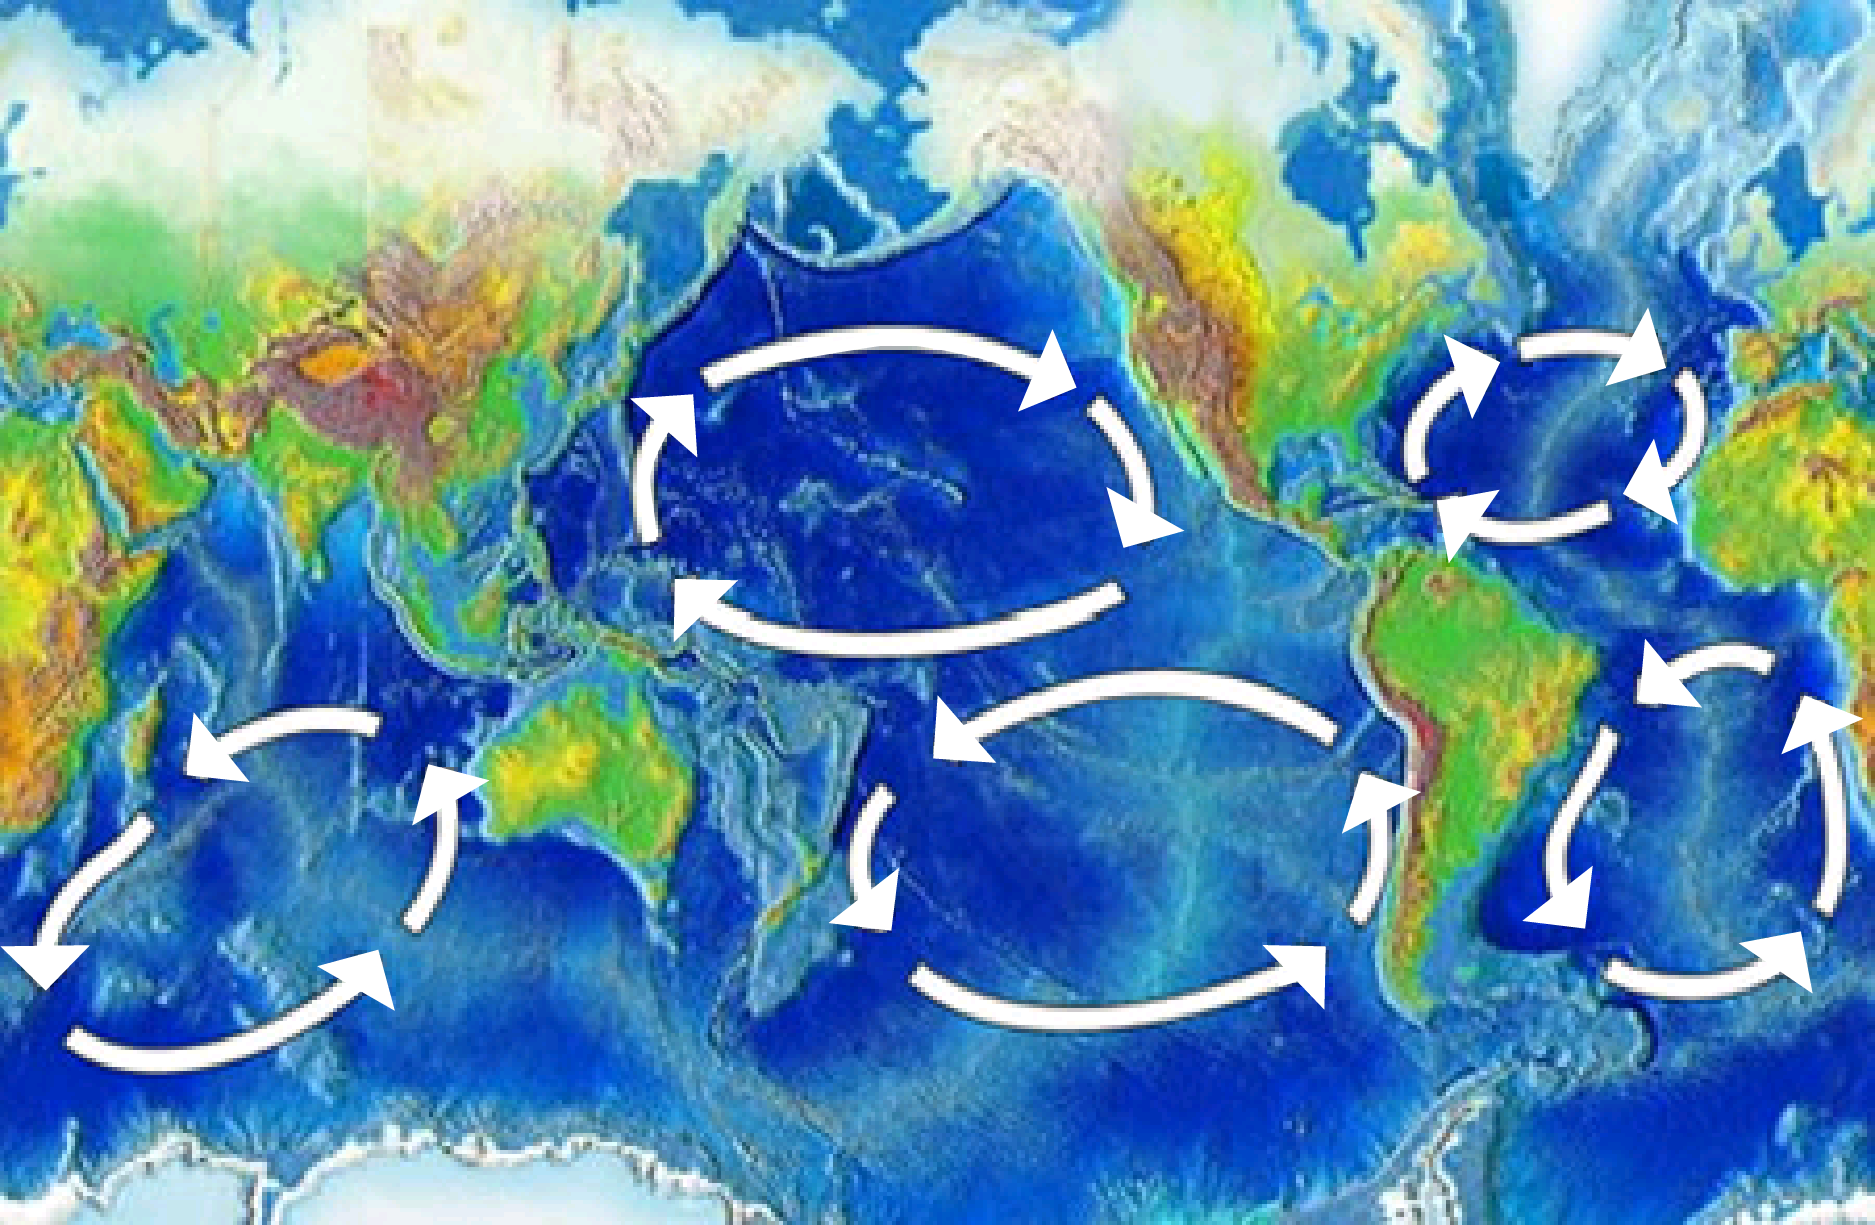
The term La Niña refers to a period of cooler-than-average sea-surface temperatures in the Equatorial Pacific Ocean that occurs as part of natural climate variability. This situation is roughly the opposite of what happens during El Niño (“the boy”) events, when surface waters in this region are warmer than normal. Because the Pacific is the largest ocean on the planet, any significant changes in average conditions there can have consequences for temperature, rainfall and vegetation in distant places. Scientists at the International Research Institute for Climate and Society (IRI), part of Columbia’s Earth Institute, expect moderate-to-strong La Niña conditions to continue in the tropical Pacific, potentially causing additional shifts in rainfall patterns across many parts of the world in months to come.

These shifts, combined with socioeconomic conditions and other factors, are making some countries more vulnerable. However, La Niña and El Niño conditions actually allow for more accurate seasonal forecasts and help better predict extreme drought or rainfall in some areas. ………..

“Based on current observations and on predictions from models, we see at least a 90 percent chance that La Niña conditions will continue through March,” said IRI’s chief forecaster, Tony Barnston.

Climate scientists have found La Niña’s fingerprints on a number of extreme weather events such as the devastating flood that occurred in Pakistan in 2010, as well as flooding in West Africa, South Africa and most recently in Queensland, Australia, where an area equal to the combined size of France and Germany was underwater. La Niña is also to blame for Cyclone Yasi, one of the strongest to hit Australia, which came ashore on Feb. 2. Cyclone Yasi is the second most damaging Australian cyclone on record after Cyclone Tracy, which struck in 1974.

But La Niña isn’t to blame for the recent severe weather affecting the Northeast. Winter weather for these regions is often driven not by La Niña but by large-scale weather patterns over the U.S., the northern Atlantic Ocean and the Arctic. These are often short-term, and are generally predictable only a week or so in advance. They are the culprits responsible for the dip in temperatures and spike in snow storms in the Midwest and Northeast.

…………

Since 1950, the world has experienced six major La Niña events, wreaking havoc in countries around the world. In 2000, for example, floods associated with La Niña affected 400,000 people in southern Africa, caused at least 96 deaths and left 32,000 homeless.

La Niña conditions typically persist for 9 to 12 months, peaking sometime during the end of the year. But 2010 was a lively year for climate scientists: For the first four months of this year, El Niño conditions prevailed in the tropical Pacific, but that quickly changed, and by June, a La Niña pattern had emerged.

“Last year’s transition from El Niño to La Niña was about the most sudden we’ve ever had,” Barnston said. “When we had rapid flips like this in the past, we sometimes ended up having a two-year La Niña, such as right after the El Niño episodes of 1972 to 1973 and 1997 to 1998.”

Barnston cautions that the likelihood of this happening with the current La Niña is unknown. “Even if we do have a second year of La Niña developing in northern summer 2011, we expect at least a brief return to neutral conditions from May to July of 2011.”

Related:

https://ktwop.wordpress.com/2011/02/03/la-nina-begins-to-show-up-in-global-temperature/

https://ktwop.wordpress.com/2011/02/05/la-nina-will-last-well-into-2011-and-could-extend-into-2012/

https://ktwop.wordpress.com/tag/la-nina/

Do super storms indicate that earth’s magnetic polarity is about to switch?

February 8, 2011


geomagnetic reversal is a change in the orientation of Earth’s magnetic field such that the positions of magnetic north and magnetic south become interchanged. These events often involve an extended decline in field strength followed by a rapid recovery after the new orientation has been established. These events occur on a scale of tens of thousands of years or longer, with the latest one (the Brunhes–Matuyama reversal) occurring 780,000 years ago.

On average geomagnetic reversals occur about every 500,000 years so it would seem that a reversal is overdue. How long a reversal takes and whether a reversal can happen very rapidly is not known. That the earth’s geomagnetic field is due to the flow of liquid metals in the earth’s interior – the dynamo theory – is also very likely. The sun’s magnetic reversals seem to happen at every sunspot maximum with an average period of 11 years between reversals giving a 22 year magnetic cycle.

The movement of Earth's north magnetic pole across the Canadian arctic, 1831-2001. Credit: Geological Survey of Canada.

The movement of Earth's north magnetic pole across the Canadian arctic, 1831--2001. Credit: Geological Survey of Canada.

The position of the magnetic poles is also continuously changing with a current drift (increasing) of the magnetic North Pole from N. Canada towards Siberia at about 40km /year. But this movement may be in some cyclic fashion and is unlikely to be directly connected to the half-million year reversals. For the last 200 years the strength of the earth’s magnetic field has been decreasing and could be the precursor of the overdue reversal.

How the earth will behave during a magnetic reversal is a known unknown and provides the basis of much speculation and cataclysmic theories which cannot be tested. The cataclysmic pole shift hypothesis is one such theory which predicts that the earth’s rotation will reverse, the magnetic field will reverse and mankind will be obliterated – probably in 2012!!

But it is thought that reversals take a few thousand years to complete, and during that time–contrary to popular belief–the magnetic field does not vanish.  Magnetic lines of force near Earth’s surface become twisted and tangled, and magnetic poles pop up in unaccustomed places. A south magnetic pole might emerge over Africa, for instance, or a north pole over Tahiti. Weird. But it’s still a planetary magnetic field, and it still protects us from space radiation and solar storms.

Terrence Aym suggests that we may be seeing the beginning of a reversal (and of course since this is overdue it may well occur at any time):

Forget about global warming—man-made or natural—what drives planetary weather patterns is the climate and what drives the climate is the sun’s magnetosphere and its electromagnetic interaction with a planet’s own magnetic field.

File:Magnetosphere rendition.jpg

Artist's rendition of Earth's magnetosphere: NASA via Wikipedia

Magnetic polar shifts have occurred many times in Earth’s history. It’s happening again now to every planet in the solar system including Earth. The magnetic field drives weather to a significant degree and when that field starts migrating super storms start erupting.

The superstorms have arrived.

The Earth’s northern magnetic pole was moving towards Russia at a rate of about five miles annually. That progression to the East had been happening for decades.

Suddenly, in the past decade the rate sped up. Now the magnetic pole is shifting East at a rate of 40 miles annually, an increase of 800 percent. And it continues to accelerate.

Recently, as the magnetic field fluctuates, NASA has discovered “cracks” in it. This is worrisome as it significantly affects the ionosphere, troposphere wind patterns, and atmospheric moisture. All three things have an effect on the weather.

Worse, what shields the planet from cancer-causing radiation is the magnetic field. It acts as a shield deflecting harmful ultra-violet, X-rays and other life-threatening radiation from bathing the surface of the Earth. With the field weakening and cracks emerging, the death rate from cancer could skyrocket and mutations of DNA can become rampant.

Another federal agency, NOAA, issued a report caused a flurry of panic when they predicted that mammoth superstorms in the future could wipe out most of California. The NOAA scientists said it’s a plausible scenario and would be driven by an “atmospheric river” moving water at the same rate as 50 Mississippi rivers flowing into the Gulf of Mexico……

According to some geologists and scientists, we have left the last interglacial period behind us. Those periods are lengths of time—about 11,500 years—between major Ice Ages. One of the most stunning signs of the approaching Ice Age is what’s happened to the world’s precessional wobble. The Earth’s wobble has stopped. ..

….So, the start of a new Ice Age is marked by a magnetic pole reversal, increased volcanic activity, larger and more frequent earthquakes, tsunamis, colder winters, superstorms and the halting of the Chandler wobble.

Unfortunately, all of those conditions are being met.

Read original article


La Niña will last well into 2011 and could extend into 2012

February 5, 2011

A new article has been posted on the National Oceanic & Atmospheric Administration website and comes to the conclusion that there is an even chance that La Niña conditions could extend into 2012:

Multivariate ENSO Index (MEI) by Klaus Wolter 4th February 2011

El Niño/Southern Oscillation (ENSO) is the most important coupled ocean-atmosphere phenomenon to cause global climate variability on interannual time scales. Here we attempt to monitor ENSO by basing the Multivariate ENSO Index (MEI) on the six main observed variables over the tropical Pacific. These six variables are: sea-level pressure (P), zonal (U) and meridional (V) components of the surface wind, sea surface temperature (S), surface air temperature (A), and total cloudiness fraction of the sky (C). …… Negative values of the MEI represent the cold ENSO phase, a.k.a.La Niña, while positive MEI values represent the warm ENSO phase (El Niño)………

Discussion and comparison of recent conditions with historic La Niña events

In the context of the rapid transition of the MEI into strong La Niña conditions, this section features a comparison figure with strong La Niña events that all reached at least minus one standard deviations by June-July, and a peak of at least -1.4 sigma over the course of an event. The most recent moderate La Niña events of 1998-2001 and 2007-09 did not qualify, since they either did not reach the required peak anomaly (the first one) or became strong too late in the calendar year (both).

The updated (December-January) MEI value has strengthened slightly to -1.62 standard deviations after almost dropping below -2 standard deviations in August-September. Nevertheless, the most recent value ranks 2nd for this time of year, clearly below the 10%-tile threshold for strong La Niña MEI rankings , but slightly weaker than the value recorded in 1974. If one were to take the average of all MEI rankings since July-August (a six-month period), the strongest La Niña half-year periods of mid-55, ’73-74, and late ’75 averaged slightly stronger than the current event, for now (this is means Rank 4 for the current event, up one from last month).
Negative SST anomalies are covering much of the eastern (sub-)tropical Pacific in the latest weekly SST map. Many of these anomalies are in excess of -1C.
For an alternate interpretation of the current situation, I highly recommend reading the latest NOAA ENSO Advisory which represents the official and most recent Climate Prediction Center opinion on this subject. In its latest update (6 January 2011), La Niña conditions are expected to last “well” into the Northern Hemisphere spring of 2011. …….. While La Niña conditions are guaranteed well into 2011, it remains to be seen whether it can rally once more to cross the -2 sigma barrier, and/or whether it will indeed last into 2012, as discussed six months ago on this page. I believe the odds for a two-year event remain well above 50%, made even more likely by the continued unabated strength in various ENSO indices.

It seems self-evident ( even if not fashionable or politically correct) that the sun controls our climate and that the oceans do the sun’s bidding as they drive the atmosphere which then determines our weather.

The consequences of an extended La Niña into 2011 / 2012 could be

  • another good monsoon year in India,
  • a cold winter again for 2011/2012 in the Northern hemishere


La Niña begins to show up in global temperature

February 3, 2011

From Dr. Roy Spencer:

credit:drroyspencer.com

…although this, too, shall pass, when La Nina goes away.

January 2011 experienced a precipitous drop in lower tropospheric temperatures over the tropics, Northern Hemisphere, and Southern Hemisphere. This was not unexpected, since global average sea surface temperatures have been falling for many months, with a head start as is usually the case with La Nina.

This is shown in the following plot (note the shorter period of record, and different zero-baseline):

credit:drroyspencer.com

Read original report: http://www.drroyspencer.com/2011/02/uah-update-for-january-2011-global-temperatures-in-freefall/

Another perversion of science: Confirmation bias in the name of global warming dogma is also scientific misconduct

January 25, 2011

A new paper has been published in Ecology Letters

Ran Nathan, Nir Horvitz, Yanping He, Anna Kuparinen, Frank M. Schurr, Gabriel G. Katul. Spread of North American wind-dispersed trees in future environmentsEcology Letters, 2011; DOI: 10.1111/j.1461-0248.2010.01573.

In this paper the authors have assumed that climate change will cause changes to CO2 concentration and wind speed. They have assumed also that increased CO2 will “increase fecundity and advance maturation”. They have then modelled the spread of 12 species as a function of wind speed.

So far so good – they have actually modelled only the effect of wind speed  which they assume will reduce due to climate change.

Their results basically showed no effect of wind speed:

“Future spread is predicted to be faster if atmospheric CO2 enrichment would increase fecundity and advance maturation, irrespective of the projected changes in mean surface windspeed”.

And now comes the perversion!

From their fundamental conclusion that wind speed has no effect and that therefore any CO2 increase resulting from climate change will enhance the spread of the trees, they invoke “expected” effects to deny what they have just shown:

“Yet, for only a few species, predicted wind-driven spread will match future climate changes, conditioned on seed abscission occurring only in strong winds and environmental conditions favouring high survival of the farthest-dispersed seeds. Because such conditions are unlikely, North American wind-dispersed trees are expected to lag behind the projected climate range shift.”

This final conclusion is based on absolutely nothing  and their modelling showed nothing and yet this paper was accepted for publication. I have no problem that a result showing “no effect of wind speed” be published but suspect that it needed the nonsense, speculative conclusion to comply with current dogma.

Science Daily then produces the headline: Climate Change Threatens Many Tree Species

when the reality is

This study Shows No Effect of Wind Speed But Yet We Believe that Climate Change Threatens Many Tree Species

“Our research indicates that the natural wind-driven spread of many species of trees will increase, but will occur at a significantly lower pace than that which will be required to cope with the changes in surface temperature,” said Prof. Nathan. “This will raise extinction risk of many tree populations because they will not be able to track the shift in their natural habitats which currently supply them with favorable conditions for establishment and reproduction. As a result, the composition of different tree species in future forests is expected to change and their areas might be reduced, the goods and services that these forests provide for man might be harmed, and wide-ranging steps will have to be taken to ensure seed dispersal in a controlled, directed manner.”

Whether the perversion is by the authors themselves anticipating what is needed to get a paper published or whether it is due to pressure from the Journal Ecology Letters or by their referees is unclear.

Abstract:

Despite ample research, understanding plant spread and predicting their ability to track projected climate changes remain a formidable challenge to be confronted. We modelled the spread of North American wind-dispersed trees in current and future (c. 2060) conditions, accounting for variation in 10 key dispersal, demographic and environmental factors affecting population spread. Predicted spread rates vary substantially among 12 study species, primarily due to inter-specific variation in maturation age, fecundity and seed terminal velocity. Future spread is predicted to be faster if atmospheric CO2 enrichment would increase fecundity and advance maturation, irrespective of the projected changes in mean surface windspeed. Yet, for only a few species, predicted wind-driven spread will match future climate changes, conditioned on seed abscission occurring only in strong winds and environmental conditions favouring high survival of the farthest-dispersed seeds. Because such conditions are unlikely, North American wind-dispersed trees are expected to lag behind the projected climate range shift.

In essence this paper is only based on belief and the results actually obtained are denied. It seems to me that denying or twisting or “moulding” results actually obtained to fit pre-conceived notions is not just a case of confirmation bias but comes very close to scientific misconduct.

New study confirms Himalayan glaciers will not disappear any time soon

January 24, 2011
This NASA image shows the formation of numerou...

Glacial lakes, Bhutan: Image via Wikipedia

Reuters reports:

(Reuters) – Some Himalayan glaciers are advancing despite an overall retreat, according to a study on Sunday that is a step toward understanding how climate change affects vital river flows from China to India.

“Our study shows there is no uniform response of Himalayan glaciers to climate change and highlights the importance of debris cover,” scientists at universities in Germany and the United States wrote in the study of 286 glaciers.

The findings underscore that experts in the U.N.’s Intergovernmental Panel on Climate Change (IPCC) were wrong to say in a 2007 report that Himalayan glaciers could vanish by 2035 in a headlong thaw. The panel corrected the error in 2010.

The report said that 58 percent of glaciers examined in the westerly Karakoram range of the Himalayas were stable or advancing, perhaps because they were influenced by cool westerly winds than the monsoon from the Indian Ocean.

Science News says:

Glaciers largely stable in one range of Himalayas

Dirk Scherler of the University of Potsdam, Germany, and his colleagues report in the January 23 Nature Geoscience. ……. but in Karakoram, 58 percent of studied glaciers were stable or slowly expanding up to 12 meters per year…..

The new findings are consistent with what Kenneth Hewitt of Wilfrid Laurier University in Waterloo, Ontario, has observed, and point to the fact “that the picture of climate change effects in high Asia is much more complicated than most people realize.”

Indeed, for much of the past century Karakoram’s glaciers were in retreat. A 2005 paper by Hewitt described a turnaround that commenced only in the late 1990s. In the new study, Scherler’s team looked for factors that might affect the responsiveness of Himalayan glaciers to regional warming. A rocky blanket quickly emerged as a major one.

D. Scherler, B. Bookhagen and M.R. Strecker. Spatially variable response of Himalayan glaciers to climate change affected by debris cover. Nature Geoscience (in press, online January 23, 2011). DOI: 10.1038/NGEO1068.

Global cooling indicators are increasing

January 23, 2011

The conditions in the relatively thin, chaotic surface layer of atmosphere surrounding the earth within the earth-sun system are what we call climate in the long term over large geographic regions and what we call weather in the short term over small geographic regions. I am convinced that these conditions are dominated by the sun and that the primary vehicles for transporting energy around the earth’s surface (and which is decisive for the chaotic boundary layer) are the oceans. The energy carrying capacity of the atmosphere is small compared to that of the oceans.

The major ocean cycles which seem to be most relevant are the Atlantic Multidecadal Oscillation (AMO) and the Pacific Decadal Oscillation (PDO). The El Niño-Southern Oscillation (ENSO) seems to be superimposed on the major cycles which which may even derive from ENSO and the deep ocean circulation patterns. The major cycles also contain sub-cycles such as the Nothern Atlantic Oscillation (NAO) or the Southern Oscillation Index (SOI). There are other minor cycles such as the Arctic Oscillation Index (AO) and the Antarctic Oscillation (AAO).

The indicators that we are in a period of 20 – 30 years of global cooling are increasing:

1. The quiet sun is perhaps the most important indicator we have that we are entering (or have entered) a global cooling period. The period 2000 – 2030 could well be similar to that during the Dalton Minimum between 1790 – 1820.

Image Attachment

graphics credit: sc25.com

2. There have been regular periods of warming and cooling in the past.

Alternating periods of warm and cooler weather have been with us as far back as our climate records go. Some of the past cooler periods have been more severe than others, like the Sporer, Maunder and Dalton Minimums. Professor Don Easterbrook has documented some 20 such cool periods over the last 500 years

Figure 1

graphic: Don Easterbrook

3. Taking just the main ocean cycles, the AMO is a 66 year cycle.

AMO peaks occurred on May 1878 and November 1944. The next peak is forecasted to occur in April 2011. The last trough occurred in January 1978, and the next trough is expected to occur in June 2044. As we see here, the length of a complete cycle is about 66.5 years.

The AMO went positive in 1994 and actually peaked in July 2010 and is now on its way down. It should go negative sometime in 2015 and remain negative till about 2048.

4. The Pacific Decadal Oscillation (PDO) has a shorter cycle of about 60 years.

graphic: digitaldiatribes.files.wordpress.com

The PDO cycle is not quite as long as AMO. Because the periods differ, their peaks and troughs will vary relative to each other. This has an interesting long-term result in terms of warming and cooling. The PDO had a peak in the function in October 1929 (about 15 years prior to AMO). The next peak occurred May 1990 (about 21 years prior to the anticipated AMO peak). The period here is about 60.5 years.

PDO has gone negative since September 2007  and will remain in negative territory probably for the next 30 years. For about 2 decades the PDO and the AMO will both be negative (but as can be seen above the amplitude of the short term variations are so large that short periods in the positive region are perfectly possible and inevitable, even while the long term average is negative or vice versa.)

5. ENSO and the efects of La Niñas and El Niños.

Returning to Matti Vooro’s article:

During negative or cool phases of PDO and AMO, there are more La Niñas than during the positive phases. This contributes to more cold winters and colder years during negative PDO. During positive or warm phases of PDO and AMO, there are significantly more El Niños. This is why there is more warming when the PDO is positive. The current negative or cool PDO and the La Niña are why we have had all the recent cold weather. The La Niña’s may have directly contributed to the Red River Flooding of 2009 and the recent flooding in Australia and Brazil.

…. The AMO is affected by ENSO cycles, especially El Ninos, so we saw a brief warming of AMO during 2010. Climate history shows that global cooling was strongest when both the PDO andAMO were both simultaneously in the negative or cool mode – like in 1964-1976 and again 1916 to 1923. The AMO cycles have been quite variable. During its last cycle it was in the negative or cool mode for 30 years (1964-1994] and its cycle seems to be related to the Meridional Overturning Circulation [MOC] and the changes in the Atlantic Thermohaline Circulation [THC]. There are a number of estimates when it will again go negative. My best estimate is about 2015 based on the most frequent past intervals of around 20 years and the cooler waters that feed the MOC from the Southern Oceans. Once it does go negative, the global temperature anomalies may drop further until about 2030, the Arctic temperature may cool further and the Arctic ice extent should increase again.

Professor Easterbrook has made a global forecast for temperature:

The IPCC projections are no longer credible but it must be borne in mind that these projections had little to do with actually bringing science to make the best forecast possible but instead were focused on poltical objectives; it seems mainly to redistribute wealth and to demonise CO2 so as to drive the carbon trading market.

That global cooling is upon us seems more and more likely and I apprehend that Easterbrooks’s lowest curve will materialise and show that the current Landscheidt minimum will be comparable to the Dalton minimum.


Indian Environment Ministry challenges IPCC and CO2 conclusions

January 21, 2011
Cropped from image of Jairam Ramesh the Indian...

Jairam Ramesh: Image via Wikipedia

That there is little love lost between Rajendra Pachauri and the Indian Minister of Environment Jairam Ramesh is no secret. (Pachauri made the ill-advised and stupid remark about “voodoo science” regarding Ramesh and the Ministry’s claims debunking the IPCC ststements on Himalyan glaciers). Now according to the Hindustan Times the Ministry of Envirionment has produced a paper concluding that solar effects on clouds represent about half the warming effects attributed to CO2:

India has once again challenged the UN’s climate science body – the Intergovernmental Panel on Climate Change (IPCC) — through a new scientific paper. The Environment ministry sponsored paper says that human induced global warming is much less than what the R K Pachauri headed IPCC had said. The cause is reduced impact of Galactic Cosmic Rays (GCRs) on formulation of low clouds over earth in the last 150 years, says a paper by U R Rao, former chairman of Indian Space Research Organisation, released by Environment minister Jairam Ramesh. ….

Analyzing the data between 1960 and 2005, Rao found that lesser GCRs were reaching the earth due to increase in solar magnetic field and thereby leading to increase in global warming. “Consequently the contribution of increased CO2 emission to be observed global warming of 0.75 degree Celsius would only be 0.42 degree Celsius, considerably less than what predicted by IPCC,” the paper said to be published in Indian Journal Current Science had said. This is about 44 % less than what IPCC had said.

Ramesh in 2009 had released a similar scientific paper saying that the IPCC’s claim that most Himalayan glaciers will melt by 2035 was wrong. A few months later, after a review the IPCC regretted the error. If Ramesh latest bid gets globally recognition, it can alter the rules of UN run climate negotiations of 200 nations.

Impact of GCRs on global warming had been highly controversial since 1998, when Henrik Svensmark of Danish National Space Center said it was causing global warming. A decade later a joint European study debunked the claim, saying there was no co-relation. …

“I just want to expand scientific debate on impact of non-Green House Gases on climate change,” Ramesh said, when asked whether he was again challenging the IPCC. “Science is all about raising questions.”

International climate science is mainly western driven and collaborates the view of the rich world that gases such as Carbon Dioxide (CO2) are the main contributor for global warming. Any scientific work challenging the view has been debunked as work of a sceptic.

“Climate science is much more complex than attributing everything to CO2,” said Subodh Verma, climate change advisor in the Environment ministry.

And, its first impact has come from IPCC chairperson R K Pachauri, who has told the government, that impact of GCRs on global warming will be studied in depth in the fifth assessment report to be published in 2013-14. In its earlier four assessment reports, IPCC had not studied the impact of GCRs in detail.

The Global Warming establishment does not much like this paper. But they have now been reduced to claiming that everything – even directly conflicting evidence – supports the theory of man-made CO2 on global warming:

V Ramanathan of US based Scripps Institute of Oceanography at University of California said the Rao’s paper strengthens the case for greenhouse a primary driver for global warming. “The observed rapid warming trends during the last 40 years cannot be accounted for (by) the trends in GCRs,” he said, in his comments on Rao’s paper.

Science is indeed all about asking questions.

It seems to have been forgotten that anyone who  is not a sceptic deep down  is not – and can not be – a scientist.

Global warming paper withdrawn for being “false and impossible”

January 20, 2011

Global warming enthusiasts are getting desperate it would seem. Perhaps they are disturbed by their crumbling credibility as the entire faith is being debunked. Polar bears are thriving and the Sun is very quiet and we are in for 20 or 30 years of a cooling trend and the effect of man-made CO2 having any significant effect on warming is looking more and more implausible. Catastrophe claims are being exaggerated to the level of the impossible and draconian measures are being called for. The global warming crowd are sounding more like eco-fascists whose creed is that discipline, prohibition, enforcement and oppression” are the only solution.

On the one hand we have one of the high priests of the global warming faith (NASA’s James Hansen) calling for authoritarian measures a la China to enforce de-carbonisation – http://hauntingthelibrary.wordpress.com/2011/01/12/hansen-us-democracy-not-competent-to-deal-with-global-warming-calls-on-communist-china-to-save-humanity/

The NASA scientist at the heart of the global warming fiasco seems set to stir more controversy after declaring in an op ed piece for The South China Morning Post and a personally published follow-up that American democracy is not competent to deal with global warming, and communist China now represents the world’s “best hope”.

In the op ed piece for the Chinese newspaper, which he entitled Chinese Leadership Needed to Save Humanity (published as The Price of Change) Hansen placed the blame for the vast majority of Co2 emissions supposedly causing global warming on his home country of America, and appealed to China not to follow the same path. Hansen said that China was the world’s “best hope” and called for them to “lead the world through the most dangerous crisis that humanity and nature have ever faced”.

In a follow-up article published on his website Hansen calls Americans “barbarians” and slams American democracy, calling for China to raise tariffs on American-made products until such time as America falls into line. …….

Hansen goes on to condemn the current democratic system in America as “dysfunctional” as it will not enact the carbon taxes he has been calling for. All is not lost, though, as he advises the Chinese government what to do about Congress in a truly incredible passage in his letter:

“However, there is a way around that, which becomes obvious with the realization that an initially modest carbon fee is in China’s own interest. After agreement with other nations, e.g., the European Union, China and these nations could impose rising internal carbon fees. Existing rules of the World Trade Organization would allow collection of a rising border duty on products from all nations that do not have an equivalent internal carbon fee or tax.

The United States then would be forced to make a choice. It could either address its fossil fuel addiction with a rising carbon fee and supportive national investment policies or it could accept continual descent into second-rate and third-rate economic well-being”.

And now we have Canadian TV revealing that

“A study warning that the planet would warm by 2.4C by 2020, creating deadly consequences for the global food supply, is being debunked as false and impossible”.

The study came from a little-known, non-profit group based in Argentina, called the Universal Ecological Fund. An embargoed copy of the study appeared on Eurekalert!, a news service operated by the American Association for the Advancement of Science (AAAS) that’s followed by many journalists.

The study was picked up by a number of international news organizations Tuesday. But it appears the study’s claims were erroneous. …… The correction came after The Guardian newspaper in the U.K. published a reaction piece to the study. The paper said it had interviewed climate scientists who told them that rapid global warming at the rates projected by the study was impossible.

“2.4 C by 2020 (which is 1.4C in the next 10 years – something like six to seven times the projected rate of warming) has no basis in fact,” NASA climatologist Gavin Schmidt told the newspaper in an email.

According to The Guardian, the study’s lead author Liliana Hisas, who is the UEF’s executive director, erred by overlooking how the oceans, which absorb heat, will compensate for global warming by delaying the effects of increasing concentrations of greenhouse gas emissions in the atmosphere.

Hisas said she stands by her report’s findings, which have been endorsed by Nobel Prize-winning Argentine climate scientist, Osvaldo Canziani.

The AAAS says that after receiving complaints that the study’s conclusions were impossible, it has removed all references to the study from its website.

“EurekAlert! deeply regrets the accidental posting of an erroneous news release on 18 January 2011,” the news service wrote in a notice to journalists who subscribe to the service.

  1. It should be noted that the Universal Ecological Fund is just another lobby group, and
  2. that “the Nobel Prize-winning Argentine climate scientist, Osvaldo Canziani” who supervised this work got his much-maligned Peace Nobel as part of the IPCC for lobbying activities and not for any scientific endeavour, and
  3. the paper seems to have received little or no competent scientific review before being published by EurekAlert

Since last ice age, warming and cooling have been caused by ocean currents

January 16, 2011

A new paper in Science giving ocean currents in the Atlantic their due (and without finding it necessary to appeal to tales of carbon dioxide). Perhaps the science is not so settled after all!

File:Oceanic gyres.png

The five major ocean-wide gyres — the North Atlantic, South Atlantic, North Pacific, South Pacific, and Indian Ocean gyres. Each is flanked by a strong and narrow “western boundary current,” and a weak and broad “eastern boundary current”: Wikimedia

The Deglacial Evolution of North Atlantic Deep Convection. by D. J. R. Thornalley, S. Barker, W. S. Broecker, H. Elderfield, I. N. McCave.  Science, 2011; 331 (6014): 202 DOI: 10.1126/science.1196812

Science Daily reports:

… Scientists have long suspected that far more severe and longer-lasting cold intervals have been caused by changes to the circulation of the warm Atlantic ocean currents themselves.

Now new research led by Cardiff University, with scientists in the UK and US, reveals that these ocean circulation changes may have been more dramatic than previously thought. The findings, published January 14, 2011 in the journal Science, show that as the last Ice Age came to an end (10,000 — 20,000 years ago) the formation of deep water in the North-East Atlantic repeatedly switched on and off. This caused the climate to warm and cool for centuries at a time.

The circulation of the world’s ocean helps to regulate the global climate. One way it does this is through the transport of heat carried by vast ocean currents, which together form the ‘Great ocean conveyor’. Key to this conveyor is the sinking of water in the North-East Atlantic, a process that causes warm tropical waters to flow northwards in order to replace the sinking water. Europe is kept warmer by this circulation, so that a strong reduction in the rate at which deep water forms can cause widespread cooling of up to 10 degrees Celsius. ….. The new results suggest that the Atlantic ocean is capable of radical changes in how it circulates on time scales as short as a few decades.

Dr Thornalley said: “These insights highlight just how dynamic and sensitive ocean circulation can be. Whilst the circulation of the modern ocean is probably much more stable than it was at the end of the last Ice Age, and therefore much less likely to undergo such dramatic changes, it is important that we keep developing our understanding of the climate system and how it responds when given a push.”

Paper Abstract:

Deepwater formation in the North Atlantic by open-ocean convection is an essential component of the overturning circulation of the Atlantic Ocean, which helps regulate global climate. We use water-column radiocarbon reconstructions to examine changes in northeast Atlantic convection since the Last Glacial Maximum. During cold intervals, we infer a reduction in open-ocean convection and an associated incursion of an extremely radiocarbon (14C)–depleted water mass, interpreted to be Antarctic Intermediate Water. Comparing the timing of deep convection changes in the northeast and northwest Atlantic, we suggest that, despite a strong control on Greenland temperature by northeast Atlantic convection, reduced open-ocean convection in both the northwest and northeast Atlantic is necessary to account for contemporaneous perturbations in atmospheric circulation.