Archive for the ‘Climate’ Category

Greenland seasonal ice melt has hardly started and is running more than one month late

May 21, 2015

The Danish Meteorological Institute reports that the Greenland seasonal ice melt is running very late and more than a month behind the 1990 -2011 mean. It is still at very low levels and the lowest recorded for this day of the year. The alarmists would have us believe that Greenland ice was/is/will be/should be melting at unprecedented rates. But there is, as always, a gross disconnect between reality and their models and their wishful thinking.

The percentage of the total area of the ice where the melting occurred from January 1 until today (in blue). For comparison the average for the period 1990-2011 is shown in the dark grey curve. The variation from year to year for each of the days during the melt season ​are shown as the gray shaded area.

Greenland ice melt far behind normal in 2015

Greenland ice melt far behind normal in 2015

h/t Real Science

Weak El Nino conditions but timely monsoon still expected

May 18, 2015

El Nino conditions can suppress the Indian southwest monsoon. Weak El Nino conditions exist for the second year running but the IMD’s forecast is for the monsoon to hit the mainland at Kerala on 30th May ± 4 days.

Whenever an El Nino is about, the doomsayers compete with catastrophe scenarios, but the possibility of a “bad” monsoon in 2015 is diminishing.The economic and industrial recovery should not be adversely affected to any great extent.

Forecasts for the last nine years (2005 to 2014) were as in the table below.

Monsoon onset dates.emf

A timely monsoon (onset during May) does not necessarily mean a “good” monsoon during the official 4 months (June to September) of the season, but does decrease the probability of a “bad” monsoon. The pre-monsoon rains during May have been somewhat higher than normal but not uniformly across the country. Rainfall at the wrong time is not that useful of course but early rainfall in May and late rainfall in October does still have value.

IMD ForecastFor the last about six months, positive SST anomalies have been prevailing over the western and the central Pacific Ocean. However, the SSTs over eastern Pacific after remaining near to below normal between late December 2014 and mid-March 2015 have now become above normal. Thus currently, weak El Nino conditions are prevailing over the Pacific.

The latest forecast from the IMD-IITM coupled model forecast indicates El Nino conditions are likely to persist during the southwest monsoon season.

At present, slight negative Indian Ocean Dipole (IOD) conditions are prevailing over Indian Ocean. The latest forecast from the coupled model indicates negative IOD conditions are likely to persist during the monsoon season. ……. the extreme sea surface temperature conditions over Pacific and Indian Oceans particularly ENSO conditions over Pacific (El Nino or La Nina) are known to have strong influence on the Indian summer monsoon.

 Quantitatively, the monsoon seasonal rainfall is likely to be 93% of the Long Period Average (LPA) with a model error of ± 5%. The LPA of the season rainfall over the country as a whole for the period 1951-2000 is 89 cm.

It is early days yet, but currently the advancing monsoon front is past the Andamans and slightly ahead of the long term average.

Monsoon front May 2015 IMD

Monsoon front May 2015 IMD

NASA “US has not seen landfall of any hurricane of Category 3 or higher for nine years”

May 15, 2015

What exactly is this man-made climate change which is caused by the use of fossil fuels?

It cannot be global warming which has been absent for almost 20 years while the use of fossil fuels has doubled.

“It is stormier weather”, I hear the warmists say.

Well not according to NASA at least for hurricanes. And when NASA can do no better than to reckon that the non-occurrence of hurricanes is a matter of “luck” I have little tolerance for the alarmists and their “religious belief” that every storm which occurs is caused by human influences.

NASA:

Statistical analyses from hurricane track data indicate that for any particular Atlantic Hurricane season, there is about a 40 percent chance that a major hurricane (category 3 or higher) will make landfall in the continental United States. However, during the period from 2006 to 2014, no major hurricanes have made landfall.
NASA’s Goddard Space Flight Center

The United States hasn’t experienced the landfall of a Category 3 or larger hurricane in nine years – a string of years that’s likely to come along only once every 177 years, according to a new NASA study.

The current nine-year “drought” is the longest period of time that has passed without a major hurricane making landfall in the U.S. since reliable records began in 1850, said Timothy Hall, a research scientist who studies hurricanes at NASA’s Goddard Institute for Space Studies, New York.

The National Hurricane Center calls any Category 3 or more intense hurricane a “major” storm. The last major storm to make landfall in the U.S. was Hurricane Wilma on Oct. 16, 2005 – the fourth major storm landfall of that year, which was the most active Atlantic hurricane season on record. Of course, storms smaller than a Category 3 have made landfall with destructive results, such as Hurricane Sandy in 2012.

Hall and colleague Kelly Hereid, who works for ACE Tempest Re, a reinsurance firm based in Connecticut, ran a statistical hurricane model based on a record of Atlantic tropical cyclones from 1950 to 2012 and sea surface temperature data. While hurricane records stretch back to 1850, the data becomes less complete prior to 1950, Hall said. The study was published recently in Geophysical Research Letters.

The researchers ran 1,000 computer simulations of the period from 1950-2012 – in effect simulating 63,000 separate Atlantic hurricane seasons. They found that a nine-year period without a major landfall is likely to occur once every 177 years on average.

While the study did not delve into the meteorological causes behind this lack of major hurricane landfalls, Hall said it appears it is a result of luck.

“The last nine hurricane seasons were not weak – storms just didn’t hit the U.S.,” Hall said. “It seems to be an accident of geography, random good luck.” ….. “Each year is roughly independent of the year before,” Hall said. “There are known signals, and natural cycles, and possibly human-induced influences. But for the most part, they are independent, especially for the rare intense landfalls.”

The Antarctic has more ice cover than has ever been measured before. Global sea ice extent is at its highest levels seen in a decade. Snow cover in the Northern hemisphere are at among the highest levels recorded. So if the 9-year non-occurrence of US hurricanes is only to be expected every 177 years, what exactly is this man-made climate change which is caused by fossil fuels?

The Lorentz effect does not apply to climate, and fossil fuels are not the “flap of a butterfly’s wings” causing climate change.

The butterfly effect

coined by Edward Lorenz, is derived from the metaphorical example of the details of a hurricane (exact time of formation, exact path taken) being influenced by minor perturbations such as the flapping of the wings of a distant butterfly several weeks earlier. Lorenz discovered the effect when he observed that runs of his weather model with initial condition data that was rounded in a seemingly inconsequential manner would fail to reproduce the results of runs with the unrounded initial condition data. A very small change in initial conditions had created a significantly different outcome”.


Reality check: Increasing sea ice making it difficult to reach Antarctic stations

May 12, 2015

This is reality – not a forecast from a a mathematical model.

news.com:

THE size and power of ships needed to break through Antarctica’s increasing sea ice levels is a worry for the global research community.

IN recent years countries including Australia have battled to reach their stations on the frozen continent, making resupply missions time consuming and expensive, Australian Antarctic Division spokesman Rod Wooding said.

“We’re noticing that the sea ice situation is becoming more difficult,” he told reporters on Monday.The sea ice through the Southern Ocean and around Australia’s Mawson Station usually breaks up for a couple of months a year allowing ships to enter the bay but that did not happen in 2013-14.“We had to get fuel in by helicopter which is inadequate for the long-term sustainability of the station,” Dr Wooding said.“Other national programs have had similar problems: the French in particular, Japanese also.”

The problem has been the main driver for a meeting of more than 50 international experts, convening in Hobart until Wednesday, to try and nut out a plan to accurately forecast sea ice levels.Meteorologists along with ice and Antarctic experts will take part in a series of workshops, looking at trends in satellite imagery and the environment.“One of the things that Antarctic programs will need to understand going forward is what sort of ice breaking capability we’re going to need to get through the ice in these areas,” Dr Wooding said.“Australia is currently in a tender process for a new ice breaker … and it’s important in understanding what sort of ice breaker we might need … to have a good understanding of likely sea ice conditions.”The

re is no single reason why sea ice levels are increasing but Hobart-based expert Tony Worby said it tends to gather around icebergs and wind patterns also play a part.“We know sea ice extent is increasing, there was a record maximum in September 2014,” Prof Worby said. “It’s quite hard to forecast but whatever effort we put in to improving our ability to forecast sea ice will ultimately pay dividends in terms of savings for national programs.”

Sunshinehours also points out that current Antarctic sea ice extent is the highest measured for this time of year. (In fact the global sea ice extent is the 3rd highest ever measured for this day of the year).

Antarctic_Sea_Ice_Extent_Zoomed_2015_Day_130_1981-2010

from sunshinehours


Adjusted (fiddled) data showing global warming to be investigated

April 26, 2015

“Global” temperature is necessarily a construct. It is “calculated” by taking raw temperature data as measured at particular locations, massaging this data according to algorithms devised by those calculating the “global temperature, applied to areas where there are no measurements by some other algorithms (oceans, poles, forests and deserts), adjusting past data and then coming up with a “global” temperature.

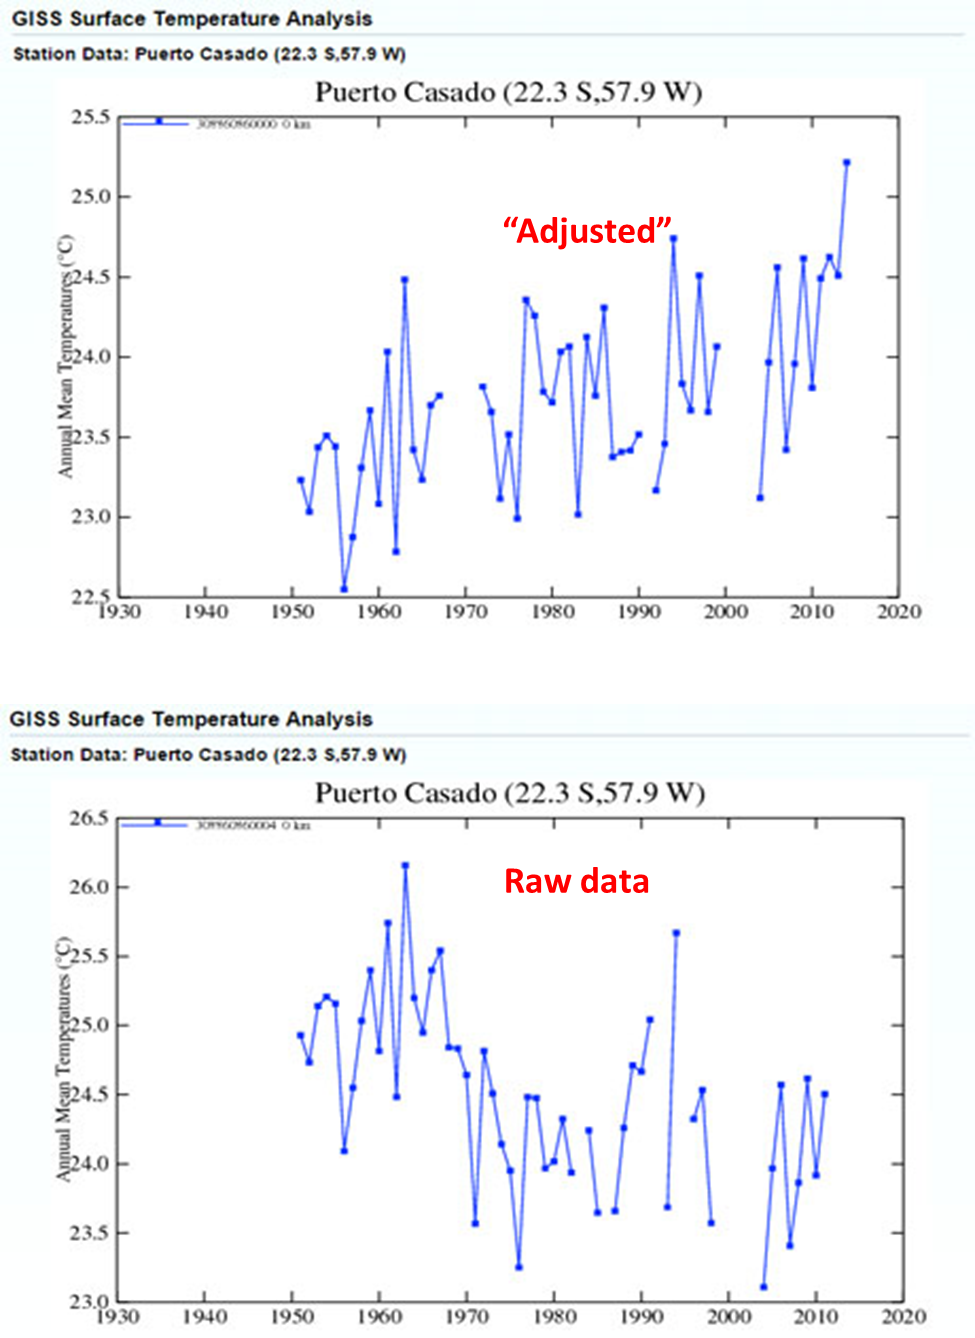
Raw data is never used without “adjustment”. Remarkably the adjustments invariably cool the past. Every year, data from the past is further adjusted! The trends and results presented represent more the adjustment algorithms used rather than the parameters themselves. As this example of “adjustment” of raw data from Puerto Casada to convert an actually measured cooling trend into an adjusted warming trend illustrates

Cooling the past: Puerto Casada From raw to adjusted data

Cooling the past: Puerto Casada From raw to adjusted data

Studies have already shown that, in the US, Australia, New Zealand, the Arctic and South America, in far too many cases, temperatures have been adjusted to show a stronger and clearer warming trend than is justified by the raw data.

As RealScience shows with this more dramatic example from Vestmanneyja

vestmannaeyja

https://stevengoddard.files.wordpress.com/2015/01/vestmannaeyja.gif?w=640

An investigation now to be carried out by an international team is to establish a full and accurate picture of just how much of the published record has been adjusted in a way which gives the impression that temperatures have been rising faster and further than was indicated by the raw measured data.

Christopher Booker writes in the Daily Telegraph:

…. something very odd has been going on with those official surface temperature records, all of which ultimately rely on data compiled by NOAA’s GHCN. Careful analysts have come up with hundreds of examples of how the original data recorded by 3,000-odd weather stations has been “adjusted”, to exaggerate the degree to which the Earth has actually been warming. Figures from earlier decades have repeatedly been adjusted downwards and more recent data adjusted upwards, to show the Earth having warmed much more dramatically than the original data justified.

So strong is the evidence that all this calls for proper investigation ………  The Global Warming Policy Foundation (GWPF) has enlisted an international team of five distinguished scientists to carry out a full inquiry into just how far these manipulations of the data may have distorted our picture of what is really happening to global temperatures. 

The panel is chaired by Terence Kealey, until recently vice-chancellor of the University of Buckingham. His team, all respected experts in their field with many peer-reviewed papers to their name, includes Dr Peter Chylek, a physicist from the National Los Alamos Laboratory; Richard McNider, an emeritus professor who founded the Atmospheric Sciences Programme at the University of Alabama; Professor Roman Mureika from Canada, an expert in identifying errors in statistical methodology; Professor Roger Pielke Sr, a noted climatologist from the University of Colorado, and Professor William van Wijngaarden, a physicist whose many papers on climatology have included studies in the use of “homogenisation” in data records.

Their inquiry’s central aim will be to establish a comprehensive view of just how far the original data has been “adjusted” by the three main surface records: those published by the Goddard Institute for Space Studies (Giss), the US National Climate Data Center and Hadcrut, that compiled by the East Anglia Climatic Research Unit (Cru), in conjunction with the UK Met Office’s Hadley Centre for Climate Prediction. All of them are run by committed believers in man-made global warming.

Since “global” temperature – by definition – is a calculated construct it is inevitable that data must be “applied” in some way to make this calculation.

But no matter what the calculation method, rewriting history is suspect. When the data of the past keeps being adjusted, and adjusted again, and always systematically downwards, and when all the adjustments invariably cool the past more than the present, then the apparent trend in global temperature has little to do with any definition of global temperature and is merely a trend of the adjustments.

Time to invest in fossil fuels as China discovers vast new reserves

April 21, 2015

There is a campaign in the western “do-gooding” and deluded “green” community (exemplified by The Guardian) to pressurise investors to disinvest from fossil fuels. Fortunately there is no shortage of investors in Asia who would be only too happy to see the European financial institutions and pension funds selling off their shares in oil, shale and coal producing and using companies. There are few better investments than snapping up artificially depressed energy shares. I am watching closely to pick up any bargains that might appear if this campaign has any impact. So far it has had little effect.

In the 1970s and 1980s the alarmist view was that coal, oil and gas would run out catastrophically. Now that peak-oil and peak-gas have been pushed out into the indeterminate future and further new shale reserves are found, the alarmism has shifted to the use of these resources being catastrophic! The campaign itself is rather idiotic (“leave it in the ground”) and counter-productive, since any success can only shift ownership of energy companies eastwards. Supposedly – but misguidedly – it is about climate but the campaign has no measurable or relevant objectives. (Note that no “climate policy”  ever has a climate parameter as an objective and which can be measured.) It will certainly not reduce the consumption of fossil fuels at all – which will instead continue to grow as developing countries develop. In fact the competitiveness of the fossil fuel using countries will be further emphasised as the “do-gooding” countries entrap themselves into a very high-cost electricity production regime based on intermittent solar and wind energy. (It is worth noting that Germany which has installed more renewable energy than any other European country now has an electricity cost which is the highest in Europe and more than twice that of the US. And yet Germany burned more coal last year than they have ever done! The German Energiwende has been a fiasco for all other than those who have milked the subsidies available)

There is – again fortunately – no prospect of India, China and other developing countries in Asia and Africa reducing their use of all the fossil fuels they have available. If I could I would be investing directly in coal and oil and natural gas and shale gas in India and China and Indonesia. At present I must satisfy myself with some indirect investment.

History will be contemptuous of the irrational demonisation of fossil fuels by the alarmists and the “do-gooders” during the late 20th and early 21st century.

Xinhua reports:

China continued to be increasingly successful at discovering crude oil and natural gas reserves last year, new data from the Ministry of Land and Resources indicated on Thursday.

The country discovered nearly 1.06 billion tonnes of new crude oil deposits in 2014, up from 1.1 billion tonnes the previous year, marking a stable increase and the eighth consecutive year in which the amount discovered surpassed 1 billion tonnes. More than 1.1 trillion cubic meters of new natural gas reserves were also discovered in 2014, a record high.

Of the new discoveries, 187 million tonnes of oil and 474.9 billion cubic meters of natural gas can be exploited with current technology, according to the ministry.

New shale gas reserves discovered amount to 106.75 billion cubic meters, with 26.69 billion exploitable.

This is the first time that proven reserves of shale gas have been publicized since the Chinese government approved the listing of shale gas as an independent mineral resource in 2011.

Discoveries of coal-bed methane, an unconventional gas, amounted to 60.2 billion cubic meters, up 155.3 percent year on year.

shale basins China (The Diplomat)

shale basins China (The Diplomat)

The Indian sub-continent too has large shale reserves waiting to be exploited. The shale basins extend into Pakistan and Bangladesh and offers Pakistan the possibility of actually becoming self-sufficient for energy.

shale gas basins India

shale gas basins India

Fossil Fuels Will Save the World (Really)

March 17, 2015

Matt Ridley has an opinion piece in the WSJ which says many things far better than I can.

The environmental movement has advanced three arguments in recent years for giving up fossil fuels: (1) that we will soon run out of them anyway; (2) that alternative sources of energy will price them out of the marketplace; and (3) that we cannot afford the climate consequences of burning them.

These days, not one of the three arguments is looking very healthy. In fact, a more realistic assessment of our energy and environmental situation suggests that, for decades to come, we will continue to rely overwhelmingly on the fossil fuels that have contributed so dramatically to the world’s prosperity and progress. …….

The article is well worth reading. Fossil Fuels Will Save the World Ridley WSJ

Ground zero is that fossil fuels will eventually be replaced only when a cheaper, more reliable source of energy (electricity production) is found. There is no foreseeable “peak” for fossil fuels and availability is not a constraint. Solar and wind technologies have small, clear niches which they can well fill but practical and affordable energy storage is needed before they can be any significant source of our energy consumption. And Li-ion batteries will not cut it. As Ridley points out they provide about 1% of our energy consumption today while fossil fuels still reign supreme at about 87%. Nuclear power could make a severe dent in fossil fuel consumption, but only if the costs and the construction time due to the regulatory process can be drastically reduced – and that does not seem likely as long as alarmists and doom-sayers hold sway. (I estimate that around 30% of the capital cost of nuclear plants is unnecessary and due to CYA regulations which are driven by fear). Small, safe, pre-approved, modular, fifth-generation nuclear power plants could take-off but that requires many alarmists to give up their faith.

(As an aside, I observe that climate and energy politics have become the politics of fear, but I am an optimist and I expect the pendulum will swing to return to energy politics based on courage. It is a form of cowardice which drives energy politics today where I take cowardice to be actions subordinated to fear and courage to be fears subordinated to purposeful actions).

Perhaps fusion (probably hot rather than cold) will come – but a breakthrough is not in sight (though by definition breakthroughs are never generally in sight). We can fantasise that we will someday be able to tap into the gravitational energy of the solar system (which would be solar energy in another form). I don’t doubt that some new, cheap, energy source or energy conversion technique will appear – but until then fossil fuels will provide the basis for human development. And if we are on our way into a new ice age it is fossil fuel which will ensure our survival.

I dismiss the hypothesis – and it is still only a hypothesis – that man-made emissions of carbon dioxide are of any significance for “global temperature”. In fact the carbon dioxide concentration in the atmosphere (and man-made emissions are a tiny contributor to that) has a very small effect on “global temperature”. Instead it is “global temperature” which has a very large effect on carbon dioxide concentration through the balance of absorption and emission from the oceans and from the biosphere. Carbon dioxide concentration lags rather than leads “global temperature”. The sun and clouds and ocean currents and winds (also driven by the sun) dwarf any effects of carbon dioxide. The hypothesis looks broken considering that over the last 18 years man-made carbon dioxide emissions have increased sharply but “global temperature” has been static. Even the assumed “global warming” that is supposed to have taken place over the last 100 years are to a significant extent “manufactured” by “adjusting” temperature data and choosing weighting and averaging algorithms which are biased to show a pre-determined result. There is a shortage of “science” and far too much confirmation bias in what passes for “climate science” these days.

Pachauri feels the heat

February 27, 2015

The Pachauri train wreck continues – a harbinger of what is to come with the global warming orthodoxy. It is now becoming clear that “much of the supposed “global warming” is due to the use of “adjusted” temperatures to cool the past!” He has been asked to resign from the Prime Minister’s Council on Climate Change, barred from entering his own offices and directed not to leave the country.

The sooner the IPCC is disbanded the better.

TOITERI chief R K Pachauri, accused in a sexual harassment case, is learnt to have been asked by the Centre to resign from the Prime Minister’s Council on Climate Change.
Sources said if Pachauri doesn’t leave the council on his own, the PMO would have to replace him by reconstituting the body.
Pachauri, who stepped down from the UN’s Intergovernmental Panel on Climate Change (IPCC) in the wake of allegations of sexual harassment levelled by a junior woman colleague, has taken leave from the Delhi-based renewable energy and sustainable development thinktank TERI.
He was on Thursday barred from entering his office premises by a Delhi court which granted him interim protection from arrest till March 27. He was also restrained from contacting TERI’s staff, witnesses in the case and the complainant and directed not to leave the country without prior permission of the court.
Pachauri’s anticipatory bail application will be taken up on March 27.

Fossil fuel use still growing and will provide over 80% of global energy in 2035

February 20, 2015

The BP Energy Outlook for 2035 is out.

  • In absolute terms total energy usage will grow 37%.
  • Two-thirds of the increase in demand is met by fossil fuels. Roughly one-third of the increase in energy demand is provided by gas, another third by oil and coal together, and the final third by non-fossil fuels.
  • In 2035 fossil fuels will still provide 81% of the world’s energy (down from 86% in 2013).

It is fortunate that man-made carbon dioxide emissions are of little significance for global warming since man-made carbon dioxide emissions will increase by over 50% in the next 20 years. But it is unfortunate that the global warming/extreme climate lobby will continue to waste precious resources in attacking something quite irrelevant. So far a massive increase in emissions has caused no global warming for over 18 years. perhaps the fanaticism will decline after another 20 years (probably when the current crop of “climate scientists” have retired).

BP Energy Outlook 2035

BP Energy Outlook 2035

Net global warming?

February 19, 2015

Climate is the integral of local weather across space and time. This is only weather of course as the bitter cold sweeps across the eastern US.

The coldest outbreak of the season is pushing south into the eastern United States this week. Temperatures will be running as low as 30 to 40 degrees below normal across the Ohio Valley and Mid-Atlantic on Friday morning. Thursday night’s departure from normal temperatures is shown above in Celsius. tropicaltidbits.com via Washington Post