Archive for the ‘Natural Phenomena’ Category

Could Mount Agung eruption be the VEI 5+ volcano that is overdue?

October 16, 2017

We have not had a VEI 5+ volcanic eruption for 26 years since the Mount Pinatubo eruption in 1991. In 2015, I pointed out that the probability of a VEI 5+ volcano eruption within 5 years was over 95%. The probability of a VEI 5+ eruption in the next two years must now be approaching 99%.

(see also The next VEI 5+ volcanic eruption is overdue).

http://geology.com/stories/13/volcanic-explosivity-index/

It has been 24 26 years since the last VEI 5+ (Mount Pinatubo, 1991, VEI 6) occurred and the probability that a VEI 5+ volcanic eruption will occur within the next 5 years is now over 95%. There are around 10 – 14 VEI 5+ eruptions every hundred years and for the the last 300 years the time between eruptions has been as short as 1 year and as long as 23 years. The current gap could be the longest recorded in three centuries. There are, on average, 2 eruptions of intensity 6 every hundred years and so the probability that an eruption of VEI 6 could occur within 5 years is about 50% (current gap 24 years, average gap 50 years). That a supervolcanic eruption of VEI 7 or greater could occur within the next 5 years is less than 1%.

Mount Agung’s volcanic activity is now reaching levels which suggests that an eruption is “imminent”.

Volcano Agung in Bali is showing worrisome signs of a major eruption, writes German climate blogger Schneefan here. The highest level of activity with multiple tremor episodes were just recorded. You can monitor Agung via live cam and live seismogram.

The 3000-mter tall Agung has been at the highest warning level 4 since September 21.

Schneefan writes that the lava rise has started and that “an eruption can be expected at any time“.

So far some 140,000 people have been evacuated from the area of hazard, which extends up to 12 km from the volcano. Schneefan writes:

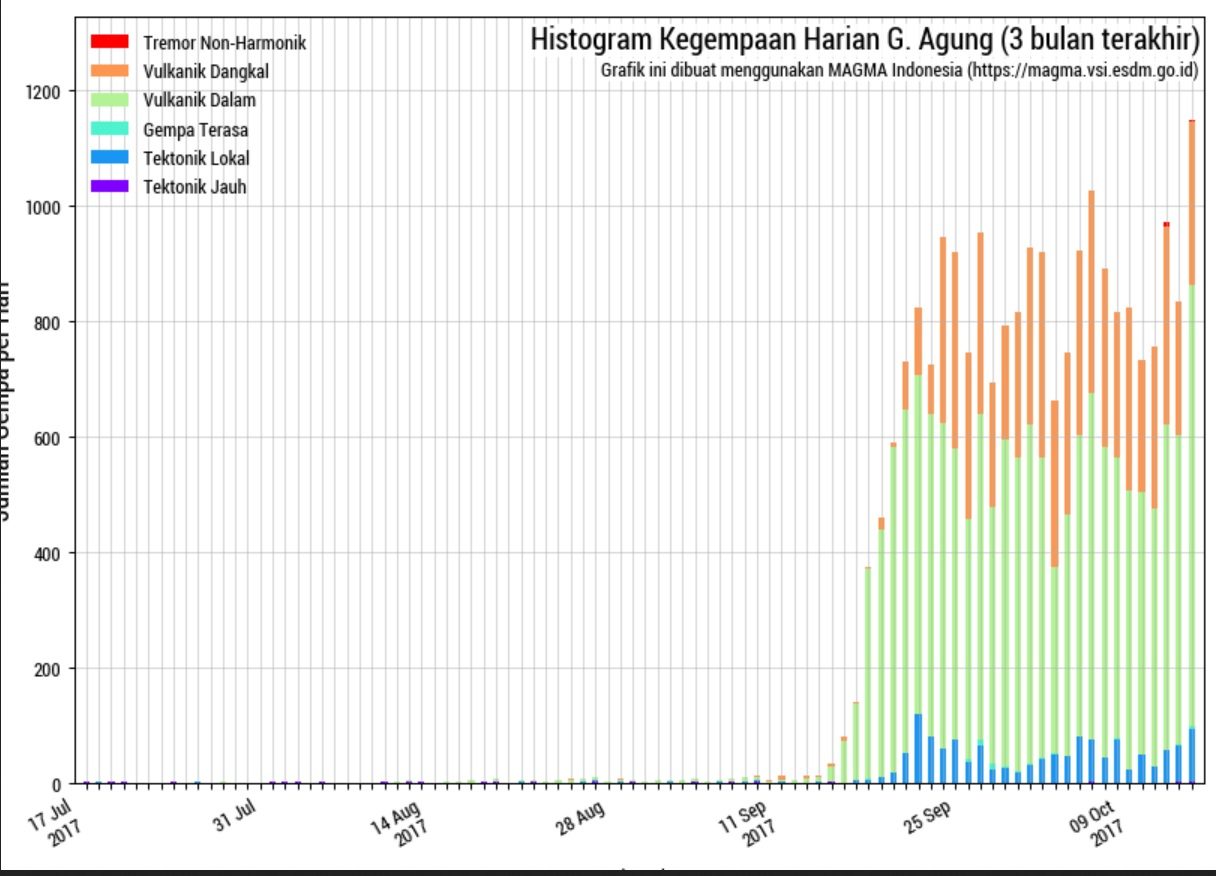
Yesterday ground activity by far exceeded the previous high level. Quakes have become more frequent and stronger, which indicates a stronger magma flow (see green in the histogram). Since October 13 there has been for the first time a “nonharmonic trembling (tremor), which can be seen in red at the top of the last two bars of the histogram.”

The colors of the columns in the bar chart from bottom to top stand for perceptible earthquakes (blue) low eartnhquakes (green) surface quakes (orange . Just recently red appeared, signifying non harmonic tremors.  The seismogram below shows what are at times longer period quakes: meaning magma is violently flowing in the volcano. Source: https://magma.vsi.esdm.go.id/.

Since yesterday the seismogram for AGUNG has been showing powerful rumbling (red).

The seismogram of AGUNG shows powerful tremors (level RED). The seismogram is updated every 3 minutes: Source: Seismogramm

Because Agung is located near the equator, a major eruption with ash flying up into the stratosphere would have short-term climatic impacts that could last a few years.

Agung last erupted in 1963 with an explosivity index of VEI 5, sending a plume of ash some 25 km into the atmosphere before leading to a cooling of 0.5°C. The eruption of Pinatubo in the Philippines in 1991 led to a global cooling of 0.5°C.


Good monsoon (so far) points to Indian GDP growth of over 8%

July 28, 2016

The monsoon season is half over and the rains are at the long-term average which is considered “good”. The difference between a “good” and a “poor” monsoon is generally thought to be over 2 percentage points for GDP.  The Indian ratings agency CRISIL is sufficiently encouraged already to begin talking about a GDP growth of over 8% for the Fiscal Year ending March 2017.

moneycontrol:A good monsoon with even rainfall distribution across regions will give a boost to farm sector and may push India’s GDP growth beyond the 8 percent mark in the current fiscal, Crisil said. However, stress in rainfall in certain parts of the country and excess downpour in some other regions may be a cause for worry, the credit rating agency said in a report. In a positive scenario — good monsoon backed by favourable temporal and spatial distribution — agriculture growth can surge to 6 percent from a weak base of last year and therefore push up GDP growth above 8 percent, it said. According to the report, assuming rainfall is evenly distributed across time and regions, GDP growth may rise to 7.9 percent, if agricultural growth comes at 4 percent and CPI inflation remains contained at 5 percent in the current fiscal. …..

Despite a slow start in June, rains have caught up and were just 1 percent below normal as of July 25. This has helped reservoirs to bounce back from the lows seen in the beginning of the fiscal, boosting farmers’ confidence, the report said. Excess rainfall in 89 districts across eight states could impact sowing and therefore agricultural output for the kharif season. Hence, spatial and temporal distribution of rainfall in the second half of the season, especially in August, will be crucial, it added. 

Today’s picture from Skymet shows the monsoon covering the entire country reasonably evenly.

24-Hours-Rainfall-28-07-2016---600

July 28, 2016 11:46 AM – Skymet


Nostradamus had nothing to say about 2016, but a VEI 5+ volcano eruption is very probable

December 31, 2015

Apart from for 1999, which is specifically mentioned in one of Nostradamus’ quatrains, there is nothing he had to say which can be specifically attributed to 2016. Moreover, not only did the King of Terror he foresaw for the seventh month of 1999 not appear, but there was no event at that time which came anywhere near to his prediction.

So the coming of WW III or of the next anti-Christ or a new invasion of Europe from the Asian steppes in 2016, as many of the Nostradamus brigade are now predicting, are not actually with any foundation. And even if they were, Nostradamus interpretations have a remarkably poor record in forecasts (but a very good record for hindcasts).

Quatrain X-72:

The year 1999, seventh month,

From the sky will come a great King of Terror:

To bring back to life the great King of the Mongols,

Before and after Mars to reign by good luck.

Depending upon calendar, the seventh month refers to July or September. During that period NATO was conducting a local air-war in Serbia and the Russians were battling rebels in Chechnya. But there was little else to match a King of Terror or a new King of the Mongols.

But I do see a high probability of a natural catastrophe during 2016.

The last 25 years have been a remarkably quiet time for major volcanic eruptions. But 2016 may well see a major VEI 5+ volcano eruption, which is now very long overdue. The Puyehue-Cordón Caulle eruption of 2012 is sometimes stated to be of strength VEI 5, but it seems more likely it was no more than a VEI 4. The last VEI 5+ eruptions were in 1991 (Mt. Pinatubo and Mt. Hudson) and that is 25 years ago. Through the 20th century, VEI 5+ eruptions occurred on an average every 7 years (max gap 23 years) and every 11 years during the 19th century. So for 2016, there is a high probability of a major volcanic eruption. Of course, the Ring of Fire is where this is most likely to occur. But my hunch is that the next major eruption could be in the Northern hemisphere. In which case the Mediterranean or Iceland come into the picture.

Ring of Fire image from http://volcanoespaster.weebly.com/

Ring of Fire image from volcanoespaster.weebly.com

I note in passing that the earth’s magnetic field continues to weaken and the poles continue to drift. It is not inconceivable that another rapid magnetic reversal event such as the Laschamp event is currently underway. Reversal of the geomagnetic field occur regularly, but slowly, over geologic time periods. The Laschamp event however occurred very rapidly with the magnetic North Pole drifting to the Antarctic and back again over some 500 years.

Phys.org: 41,000 years ago, a complete and rapid reversal of the geomagnetic field occured. ……. What is remarkable is the speed of the reversal: “The field geometry of reversed polarity, with field lines pointing into the opposite direction when compared to today’s configuration, lasted for only about 440 years, and it was associated with a field strength that was only one quarter of today’s field,” explains Norbert Nowaczyk. “The actual polarity changes lasted only 250 years. In terms of geological time scales, that is very fast.” During this period, the field was even weaker, with only 5% of today’s field strength. As a consequence, the Earth nearly completely lost its protection shield against hard cosmic rays, leading to a significantly increased radiation exposure.

Two other events of note occurred simultaneously – though that may just be coincidence. Forty thousand years ago is close to the time when the Neanderthals disappeared as a separate species and continued only as those absorbed within modern humans. It was also the time when the supervolcano (VEI 7+) erupted 39400 years ago in the area of today’s Phlegraean Fields (Campi Flegrei) near Naples. It was the largest volcanic eruption on the Northern hemisphere in the past 100 000 years.

The polarity reversal was a global event. © Dr. habil. Norbert R. Nowaczyk / GFZ

The magnetic poles are already a long way away from the geographic poles. The South magnetic pole in particular is already outside the polar circle.

NOAA: The most recent survey determined that the Pole is moving approximately north-northwest at 55 km per year.

Currently, in 2015 the location of the north magnetic pole is 86.27°N and 159.18°W and the south magnetic pole is 64.26°S and 136.59°E.

Pole reversal is not a catastrophic event in itself. Even with a weak magnetic field, the atmosphere provides good protection against radiation and the effects would probably not be catastrophic. But the indirect effects of changing flow patterns in the earth’s core (which might be the cause of geomagnetic reversal), on tectonics, volcanic activity and climate may be much more profound. My gut tells me that that the releases of energy which accompany major earthquakes and volcanic eruptions can only be explained by the flow patterns in the earth’s core which power the movement of the tectonic plates – and also control the earth’s magnetic field.

If last year the probability of a VEI 5+ eruption was said to be 95% over the next 5 years, then the chances of a major eruption in 2016 are now quite high.

Relief supplies in Chennai being held up by AIADMK party workers for publicity stickers

December 6, 2015

The rains in Madras (Chennai) have been the heaviest in 100 years. Which only proves that the climate is only doing what it has done before. Global warming and climate change have nothing whatever to do with the current situation. The flooding is unprecedented however. But it is the real estate feeding frenzy which has seen the old water bodies disappear as they were drained to satisfy the lust of the building developers. In addition, low lying areas have been paved over to give way to high rise monstrosities to satisfy the growth of the city, but the drainage provided has been at the minimum required by inadequate planning standards. Storm drains have not been given much thought. That water now collects in these low lying areas since there are inadequate run-off possibilities, makes the current flooding almost inevitable. Developers have gotten away with it because such heavy rains don’t come that often. Needless to say that the new IT corridor with its glistening, futuristic offices, is among the worst affected.

There will be much wailing and gnashing of teeth, and many innocent scapegoats will be found as the post-mortem gets under way once the waters recede, and the clean-up begins. I heard this morning that food prices are going through the roof (not unexpected) but at least water supply sources have not been reported to have been contaminated. Water snakes are having a field day but they are, at least, not venomous. Transport is paralysed though the airport opened again today. One unexpected problem is that bodies from deaths quite unrelated to the flooding are accumulating in homes and make-shift “cool houses”, for want of the ability to cremate them. (Normally cremation occurs within 24 – 48 hours of death). The highest risk for disease will probably come just after the waters recede and people become mobile again.

One does not expect, even at the best of times, that political party workers have any ethical standards at all (let alone any high standards). But the reports this morning that AIADMK party workers have been holding up relief packets just so that can first stick on pictures of the Chief Minister (Jayalalitha), must be a new low even for them.

LivemintAll India Anna Dravida Munnetra Kazagham (AIADMK), the ruling party of Tamil Nadu led by J Jayalalithaa, promised to take strict action against party workers who blocked volunteers or forced them to paste her pictures on relief materials meant for Chennai flood victims. ….

The AIADMK party workers’ decision to stick Jayalalithaa’s pictures on relief material and use the rescue efforts for publicity faced severe criticism from Chennai residents and others on social media.

While the rains have subsided, the city and other parts of Tamil Nadu are yet to recover from the flooding caused by the heaviest rains in a century that claimed over 300 lives and forced the National Disaster Response Force (NDRF) to undertake its most massive flood relief operation ever.

The waters are beginning to recede though further heavy rain is again forecast. Hopefully the worst is over and the relief has begun to flow in earnest. But the clean up will take some time.

There is behaviour and there is behaviour, but party political workers are a species unto themselves.

Hurricane Patricia – 200 became 165, potentially catastrophic became no significant damage – why the hype?

October 24, 2015

It was the strongest storm ever recorded. It was the most dangerous storm in history. Such strong winds had never been recorded before. It was going to cause catastrophic damage. The banner headlines were spread in the mainstream media across the globe.

But Patricia has fizzled to a Category 2 storm just a few hours after landfall. No serious damage so far.

Was there an agenda to the world-wide hype? Remember the hype about Hurricane Joaquin just a few weeks ago. It didn’t even make landfall and in the course of just a few days the forecast course changed by some 6,000km. Remember Typhoon Haiyan. Strongest ever winds of 200 MPH  were predicted hours before landfall. By the time it made landfall it was a tropical storm. Is there a pattern to the hype?

Hurricane Joaquin post mortem -- tracks from RealScience

Hurricane Joaquin post mortem — tracks from RealScience

This morning I learn that Hurricane Patricia has made landfall and is weakening. The expected 200mph winds had become less than 165mph by landfall. From Category 5 it has been downgraded to Category 2. So far minor landslides and fallen trees have been reported. How come they were “destructive winds and rain” but “heavy damage was avoided”? Destructive without damage? We used to call that non-destructive.

BBC: 

The storm touched down in western Mexico, bringing destructive winds and rain, but heavy damage appears to have been avoided.

The US National Hurricane Center said the hurricane hit as a Category Five storm – the highest classification.

It said “life-threatening flash floods and mudslides” were now likely.

The states of Nayarit, Jalisco, Colima, Michoacan, and Guerrero are in particular danger as the storm moves inland, the centre says.

Four hours after making landfall as the strongest recorded hurricane, Patricia weakened to a Category Four, and is likely to be downgraded to a tropical storm in the coming hours as it passes over mountainous regions.

“The first reports confirm that the damage has been smaller than that corresponding to a hurricane of this magnitude,” Mexico’s president, Enrique Pena Nieto, said in a televised address.

Mexican federal police said only “minor landslides and fallen trees” had so far been reported in Colima.

I don’t suppose that the hype has anything to do with the approaching Paris conference on wealth distribution (ostensibly about global warming)?

I note that Mexico is expecting to be a beneficiary from the Paris largesse.

Half-way through, Indian monsoon on course to be close to “normal”

July 31, 2015

Compared to “normal” the Indian monsoon has a large downside and a limited upside. It is thought that a “bad” monsoon (accumulated rainfall 20% less than normal) can depress GDP by 2 percentage points. A “good” monsoon (20% greater than normal) however can raise GDP by only about 1 percentage point since the benefits are capped by areas of local flooding. The monsoon lasts 4 months (June – September) but its indirect effects are felt all the way through to the start of the next monsoon. Agriculture contributes only 17% of India’s GDP directly but agriculture employs almost 65% of the Indian work-force.

Indian Economy

The immediate impact of a good monsoon is increased employment in rural areas (September – October) followed by increased rural consumption of consumer goods (October – December) and even sales of two-wheelers and tractors (November – March). Pesticide sales increase during the monsoon and again in the following pre-monsoon period. Fertiliser sales pick-up strongly in the pre-monsoon period following a good monsoon. The December – June period following a good monsoon is when rural “investments” are mainly made (machinery, equipment, construction, consumer goods). The indirect effects of agriculture on the services and manufacturing sectors are critical. However, even more important is the effect of a good monsoon on food price stability and general economic sentiment.

The current monsoon is now half-way through. June saw accumulated rainfall about 15% higher than normal while July has seen a shortfall of about 16%. For the 2 months the accumulated rainfall is now just short of “normal”. Revised forecasts are for a small shortfall during August followed by some excess in September and for the whole period rainfall to be close to “normal”. Timing of rainfall is important but the rains have kept reasonably close to the expected time-line.

The potential downside of a “bad” monsoon seems to have evaporated. My conclusion is that India should see a strong growth period in the September 2015 – May 2016 period, as the Modi government’s sluggish reforms pick up some steam and as the seasonal effects of a near-normal monsoon trickle through the economy.

865,000 evacuated as Typhoon Chan-hom heads for landfall today

July 11, 2015

Close to a million people have been evacuated and almost 30,000 fishing boats have been recalled to port as Typhoon Chan-hom approaches Sheijiang on the East China coast.

CRIMore than 865,000 people in the eastern Chinese province of Zhejiang have been evacuated as super Typhoon Chan-Hom, the second typhoon to hit China in two days, approaches.

A total of 28,764 ships had been recalled to port as of 10 p.m., Friday, and several cities were already reporting heavy rain and strong gales, the provincial flood, typhoon and drought headquarters said.

The National Meteorological Center (NMC) issued a red alert, the highest level, on Friday morning for the super typhoon.

At 0900 local time on Saturday, the typhoon was around 115 kilometres southeast of Zhejiang province over the East China Sea and forecast to make landfall in Zhejiang on Saturday in the afternoon. It could be the most powerful typhoon to hit the area since 1949.

Image from Pacific Disaster Center:

Typhoon Chan-hom July 10th 2015

Typhoon Chan-hom July 10th 2015

Monsoon recovers from slow start – rainfall running 20% higher than “normal”

June 29, 2015

The SW Monsoon has, after a late, slow start, spread across all of India and is just crossing the NW frontier into Pakistan. This normally only happens around the 15th of July. Just 5 weeks ago the IMD’s updated long range forecast (Forecast 2) warned that the monsoon would be later than predicted and that total rainfall could be deficient.

  1. Rainfall over the country as a whole for the 2015 southwest monsoon season (June to September) is likely to be deficient (<90% of LPA).
  2. Quantitatively, monsoon season rainfall for the country as a whole is likely to be 88% of the long period average with a model error of ±4%.
  3. Region wise, the season rainfall is likely to be 85% of LPA over North-West India, 90% of LPA over Central India, 92% of LPA over South Peninsula and 90% of LPA over North-East India all with a model error of ± 8 %.
  4. The monthly rainfall over the country as whole is likely to be 92% of its LPA during July and 90% of LPA during August both with a model error of ± 9 %.

Moreover the risk of this being a La Nina year could further depress rainfall, we were warned by IMD. The fear of drought led to government updating emergency plans and for state governments to prepare emergency budgets. A private forecaster, Skymet,  however suggested that Indian farmers need not worry too much.

Economic Times Skymet is a young weather forecasting agency that has, with gradually amplifying audacity, been challenging the monopoly of the India Meteorological Department (IMD), the hoary state-led colonial-era institution, on matters related to climate and weather in India. ….. The IMD has usually been the final word on droughts but this time Skymet has asserted that the IMD is grievously mistaken. The IMD expects India to get ‘below normal’ rains during the coming monsoon months between June and September whereas Skymet says farmers and citizens needn’t be worried: India is going to have ‘normal’ rains.

(The IMD scientists – based on my small experience with them – are very sober and very rigorous, doing good science. But the organisation’s presentation skills are conspicuous by their absence and their public relations skills are sadly lacking. The IMD website is particularly poor. They have little clue as to how to present their forecasts for the media or the general public.)

In the event, the monsoon has surged over the last 10 days and the all-India-spread has been reached almost 2 weeks earlier than “normal”. Last year this was achieved on 17th July.

Monsoon spread till 28 June 2015 - Skymet graphic from IMD data

Monsoon spread till 28 June 2015 – Skymet graphic from IMD data

It is still early days and the monsoon is only one month into its 4 month season, but currently the rainfall (weighted average) is running some 23% above “normal”. So far it would seem that Skymet’s optimism may be closer to the mark than IMD’s dour pessimism. A weak La Nina year is still possible but 2015 will not go down as a peak La Nina year.

Rainfall during June 2015

Rainfall during June 2015

In the wettest East/North East region, rainfall is close to normal. In all other regions rainfall has been “in excess”. So far the cumulative rainfall would be classified as being “plentiful”.


Monsoon slow to reach North West but rainfall running 11% above average

June 22, 2015

In spite of a forecast of a deficient monsoon, a late start and a possible El Nino year, so far, so good.

The advance of the monsoon front is a little slow across central India and into the North West. Pakistan is experiencing a heat wave.

monsoon advance June 21st 2015 - IMD

monsoon advance June 21st 2015 – IMD

Rainfall has been holding up quite well. Accumulated rainfall across the entire country (weighted average) in the 3 weeks of the 16 week long monsoon season is running about 11% higher than the long-term average. Rainfall is deficient (from a low expected value) only in the North West region and is above average elsewhere. Even rainfall in the Southern region which often starts deficient is running some 20% above average. In this period the heaviest rainfall is usually in the North East and even here it is running 5% above normal.

rainfall till 20th june 2015 - IMD

rainfall till 20th june 2015 – IMD

The start, at least, is better than was feared and the government will be relieved that the emergency plans for “drought” conditions will not, yet, need to be activated.

Mt. Sinabung lava dome now at 3.3 million cubic metres and still growing

June 15, 2015

Mt. Sinabung started erupting on 27th August 2010 after being dormant for 400 years. It has caused evacuations a number of times and has then quietened down only to start again a few weeks later. Lava flows have reached some 5 km from the summit on a number of occasions. 16 people were killed in early 2014. Mt. Sinabung gives the impression of building up for what could be the next VEI5+ volcanic eruption. One visual indicator is the size of the lava dome building up though it cannot be predicted as to how large a lava dome can get before it collapses. Multiple small collapses are much preferable to a single large collapse. But this lava dome has now grown to about 3.3 million cubic metres.

The shape and size of lava domes varies greatly, but they are typically steep-sided and thick. The thickness can range anywhere from a few meters to nearly one kilometer in height. The diameter or length of these domes can range from a few meters to many kilometers. The form that the dome takes is a function of many factors including strength and viscosity of the lava, as well as the slope of the land they are erupted onto.

On June 6th the lava dome at Mt. Sinabung was assessed to have reached 3.1 million cubic metres having grown around 100,000 cubic metres from the day before. Further assessment since then has been masked by cloud and smoke from the simmering and ongoing eruption. Yesterday “Sinabung spewed hot clouds reaching 3,500 meters to the south and 2,500 meters to the southeast.”

Wrath of Sinabung:: Burning lava streams from the peak of Mount Sinabung in Karo, North Sumatra, Thursday night. The volcano has been spewing lava 100 times a day since the alert was raised to the highest level on June 2, monitors say. (Antara/Zabur Karuru)

Burning lava streams from the peak of Mount Sinabung in Karo, North Sumatra, Thursday night. The volcano has been spewing lava 100 times a day since the alert was raised to the highest level on June 2nd. (Antara/Zabur Karuru) – Jakarta Post

Jakarta Post:

“In today’s eruption, Sinabung’s hot clouds simultaneously moved to the south and southeast. The hot cloud releases to the south reached 3,500 meters, or farther than the ones in the southeast, which reached 2,500 meters. This is because the lava dome is in the southern side of Mt. Sinabung,” Deri told The Jakarta Post on Sunday.

He said Mt. Sinabung still had a huge potential to erupt as the volume of its lava dome was still quite large.

“From the latest data, the volume of Mt. Sinabung’s lava dome has reached 3.3 million cubic meters. Eruptions previously occurred have not yet fully abolished its lava dome; thus, there is still a potential for massive eruptions,” said Deri.

Pyroclastic flows are caused by collapse of parts of the lava dome. On 14th June around ten flows were observed descending to the south-east and through the east-North-east channel.