Archive for the ‘Economy’ Category

Extreme poverty at all time global low while population is at an all time high

October 5, 2015

Being poor is a relative term. To be in “extreme poverty” is an absolute measure. To be “poor” does not require being in “poverty”. The “poor” relative to the “rich” will always be with us and are just as necessary as the “rich”. In fact, that distinction between rich and poor is necessary as long as humans are to be considered individuals with aspirations and not just clones. Income inequality is often equated – especially by those with communistic leanings – with poverty, but this is simply wrong. Income inequality may be an indicator of the ratio of “poor” to “rich” but to be “poor” need have nothing to do with being in “poverty”. “Poverty” is not necessary and the goal is to eliminate extreme poverty by 2030.

The 2015 World Bank Research Note on Extreme Poverty is now out. In 2015, for the first time ever, and in spite of the global population being at an all time high, the number of people in extreme poverty has reduced to less than 10%. In spite of the population increase, the total number in extreme poverty is at the lowest in 25 years. But that is still 700 million (900 million in 2012) in extreme poverty. Sub-Saharan Africa and S Asia are where the misery is concentrated.

Extreme Poverty - World Bank 2015

Extreme Poverty – World Bank 2015

Press Release:

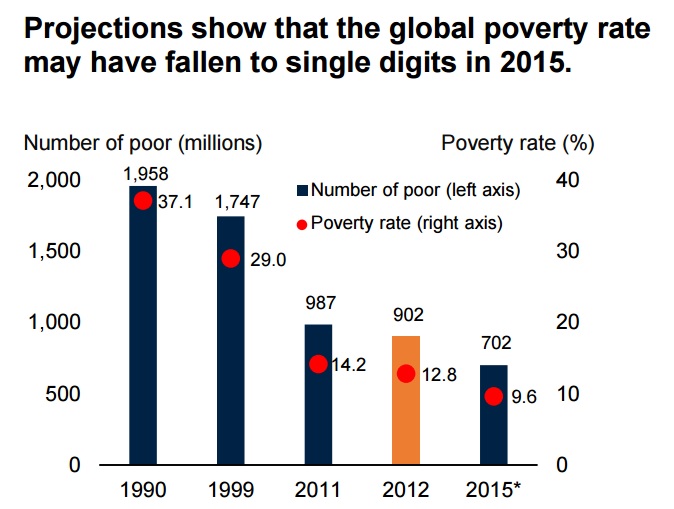
The number of people living in extreme poverty around the world is likely to fall to under 10 percent of the global population in 2015, according to World Bank projections released today, giving fresh evidence that a quarter-century-long sustained reduction in poverty is moving the world closer to the historic goal of ending poverty by 2030.

The Bank uses an updated international poverty line of US $1.90 a day, which incorporates new information on differences in the cost of living across countries (the PPP exchange rates). The new line preserves the real purchasing power of the previous line (of $1.25 a day in 2005 prices) in the world’s poorest countries. Using this new line (as well as new country-level data on living standards), the World Bank projects that global poverty will have fallen from 902 million people or 12.8 per cent of the global population in 2012 to 702 million people, or 9.6 per cent of the global population, this year.

Extreme Poverty contributions - World Bank 2015

Extreme Poverty contributions – World Bank 2015

GDP gives innovation …. or is it the other way around?

October 2, 2015

From The Economist.

To be fair it is quite easy to argue that the absolute value of GDP is conducive to innovation but that innovation leads to GDP growth.

Global Innovation Index 2015 image The Economist

Global Innovation Index 2015 image The Economist

…. The Global Innovation Index and a related report, which were published this morning by Cornell University, INSEAD, a business school, and the World Intellectual Property Organisation. The ranking of 140 countries and economies around the world, which are scored using 79 indicators, is not surprising: Switzerland, Britain, Sweden, the Netherlands and America lead the pack. But the authors also look at their data from other angles, for instance how countries do relative to their economic development and the quality of innovation (measured by indicators such as university rankings). In both cases the results are more remarkable. The chart above shows that in innovation many countries in Africa punch above their economic weight. And the chart below indicates that, even though China is now churning out a lot of patents, it is still way behind America and other rich countries when it comes to innovation quality.

Indian monsoon season ends – deficient but no disaster

October 2, 2015

The official 4 month monsoon season (June – September) has ended and the cumulative rainfall falls into the “average” category (from -20% to + 20% of the long-term average), but only just, at -14% for the country as a whole. Rainfall was high in June, quite low in July and August and recovered somewhat in September. Good rainfall continues in October as the monsoon withdraws. Much of this is in deficient regions of Central and South India which will further mitigate the deficiency numbers.

There is some relief that in spite of 2015 being an El Niño year, the overall picture is one of some deficiency but no disaster. Locally there have been wide variations, even between contiguous regions:

  • Jammu & Kashmir recorded 15% excess rains, while next door, Himachal Pradesh was 23% deficient.
  • West Rajasthan recorded 46% excess, while East Rajasthan ended 10% down.
  • Telangana remained rain deficit to the tune of 20% and Andhra Pradesh recorded 10% excess.
  • West Madhya Pradesh recorded normal rains and was at +4% while East Madhya Pradesh was 29% in deficit.
  • West Bengal recorded 8% excess while adjacent Jharkhand was 14% in deficit.
  • Both Marathwada (-40%) and Vidarbha (-11%) were in rain deficit but the variation was large.

From a growth perspective, the 2015 monsoon will be a neutral event (i.e. it will make its “normal” contribution to the economic cycle). The impact will not provide any additional impetus to growth but will not hinder growth either.

As the Reserve Bank has now reduced its reference interest rates by 50 basis points and most of the banks now seem to be passing on about 40 basis point reductions to their lending rates, the cost of lending is likely – for this year – to be have a much greater impact on the economy than the effects of the monsoon. But at least the monsoon will now play its “normal” part in feeding the economic cycle. The monsoon deficiency should not contribute too much to inflation in food prices.

The immediate impact of a good monsoon is increased employment in rural areas (September – October) followed by increased rural consumption of consumer goods (October – December) and even sales of two-wheelers and tractors (November – March). Pesticide sales increase during the monsoon and again in the following pre-monsoon period. Fertiliser sales pick-up strongly in the pre-monsoon period following a good monsoon. The December – June period following a good monsoon is when rural “investments” are mainly made (machinery, equipment, construction, consumer goods). The indirect effects of agriculture on the services and manufacturing sectors are critical. However, even more important is the effect of a good monsoon on food price stability and general economic sentiment.

But I foresee no booms or fireworks in Indian economic activity over the next 6 months. That requires – among other things – the “feel-good” factor that a bumper monsoon brings. Still, 12 months of steady, sustainable growth is probably more valuable than some short-lived volatile balloon of activity.

After the China circus, steady rather than spectacular will be a welcome relief.

Monsoon 2015 - Deficient but no disaster Source IMD

Monsoon 2015 – Deficient but no disaster Source IMD

The economy is to a car as interest rates are to the suspension

September 16, 2015

Cutting interest rates is the traditional method of fighting deflation and stimulating an economy. Just as increasing interest rates was the way to go with overheated economies with high inflation. But as Japan found out, and now much of the industrialised world is finding out, when interest rates are already very low, they are no longer a tool to fight deflation with. In fact going to even negative interest rates dampens all economic activity.

The physical analogy I like is of the economy being a vehicle on tensioned springs. I prefer the suspension analogy to that of interest rates acting as either accelerator or brake. As long as the springs are in tension the suspension can be tightened (hard springs) or loosened (soft springs) to suit the bumps and type of bumps on the road. Take this simple description from a suspension tuning blog:

The purpose of the springs are to control wheel movement and keep the tyre in contact with the road over bumps and undulations. Stiffening the springs front and rear will reduce body roll and make handling more responsive, but cause a loss of traction over bumpy surfaces. Likewise, softening all of the springs will give more grip on bumpy tracks, but increase roll and reduce responsiveness.

Paraphrasing in terms of the economy I get:

The purpose of the interest rate is to control movement in the economy and keep the entire economy steady despite the bumps and undulations in different sectors. Increasing interest rates will restrict overspeeding in economies growing fast, but will cause a loss of control when growth is low or sectors are growing at uneven rates. Likewise, reducing interest rates will give more traction in low speed economies to sectors with low growth, but can give rise to uncontrolled expansion (bubbles) in other sectors.

Of course, it is only an analogy, but taking it just a little further, the low-interest rate regimes that are prevailing are akin to having no tension at all in the suspension. Trying to tune a floppy, tension-less suspension on a very bumpy road is futile. Taking interest rates negative is equally futile. My take-away is that the floppy springs have to be changed-out or you have to go off-road or get onto another road. Right now the springs are broken – not just floppy. We are in interest-rate territory where they no longer function. If this analogy holds, then it is not messing about with very low interest rates which can help. It needs a fundamental change in the way taxes are raised to change the economic road being travelled.

So my recipe for stimulating economies now stuck in the doldrums, would leave interest rates alone for the time being, but provide tax-cuts or tax-credits to real activity that increased turnover or jobs – but only after the increased turnover or jobs had been delivered. The benefits should be for growth delivered. Increasing profit while turnover is reducing should be a sin. So should be increasing spending when there is no growth. Changes to public expenditure should then be made contingent upon – but lagging – actual growth. Wages and salaries ought then to be in line with growth achieved and not with inflation. The same job in a successful business should pay more than in a failing business. How not?

Nothing is as simple as it seems but the idea that public expenditure can lead growth is totally flawed. Equally, just cutting public expenditure (austerity), without also providing for economic stimulation – in the form of judicious tax benefits (after the event), is a cul-de-sac. Going back to a horse-and-cart might sound idyllic but resolves nothing and only increases misery.

Don’t mess with negative interest rates. Instead, stimulate jobs. Cut the cost and long-term liabilities of employing people and more people will inevitably be employed. A too high entry wage and long-term employment commitments when the future is uncertain, are the biggest barriers to creating new jobs. Profits are for the shareholders but the turnover is for the economy. Focus then on turnover as the deliverable from any business to the economy at large and provide real tax benefits for generating such turnover.  Cut the crippling costs for establishing or expanding turnover and both growth and employment will benefit.


Clinton – artificial, Trump – genuine?

September 8, 2015

Sanders has now gone ahead of Clinton in one poll. Donald Trump maintains his lead.

The New York Times reports that Hillary Clinton’s strategists will now ensure that she shows “more humour and heart” and I wondered if this was not one of the key differences of perception between Trump and Clinton (and all other “conventional” politicians). Clinton and other politicians have strategists and aides who analyse and create an artificial persona that their principal is then supposed to put on show. The perception then is that whatever they say or do is then in support of this artificial persona, which has been calculated as being the most likely to gain voter support. With Trump however the perception is that you get to see the real Trump – warts and all. Real beats artificial.

Add to this the perception that Trump needs no funding from sponsors – looking for their pound of flesh – and is beholden to no one. I begin to think that what is driving the support for Trump is the voter fatigue with conventional politicians who are calculatedly artificial and who are in hock to their donors. Trump’s convictions are perceived to be real while those of others are seen to be “bought” and artificial.

Nobody doubts, even when Trump displays his ignorance in some areas – especially of foreign affairs – that he can always surround himself with knowledgeable people. And nobody doubts either that if he picks the wrong people, he knows how to fire them. It is his real track record being pitted against the implied erudition of others.

I see also that Paul Krugman is generally scornful of the economic policies of all the GOP candidates and especially those of Bush. In his latest column he puts Trump as the best of a bad lot. But one look at Trump’s real billions render all Krugman’s jargon and all his (failed) theories utterly toothless. In one phrase, Krugman basically stands for increased public spending. In fact, in a battle for minds between Trump’s real billions and Krugman’s artificial theories, the real billions on the bottom line carry much more credibility. Krugman stands for debt while Trump stands for real wealth.

If a perception that being “real” is what trumps being “artificial” is the theme now driving US voters, then Trump is going to be around for a long time yet. Conventional, artificial politicians (GOP and Democrat) are going to have a tough time against people fed-up with being sold made-up story lines.

NYT:  ……. In extensive interviews by telephone and at their Brooklyn headquarters last week, Mrs. Clinton’s strategists acknowledged missteps — such as their slow response to questions about her email practices — and promised that this fall the public would see the sides of Mrs. Clinton that are often obscured by the noise and distractions of modern campaigning. 

They want to show her humor. The self-effacing kind (“The hair is real, the color isn’t,” she said of her blond bob recently, taking note of Mr. Trump) has played better than her sarcastic retorts, such as when she asked if wiping a computer server was done “with a cloth.” …

They want to show her heart, like the time she comforted former drug addicts in a school meeting room in New Hampshire.

But the widespread presumption of Hillary Clinton as being untrustworthy, cold, calculating and not very effective (Libya) is firmly ingrained. To now try and show her as being a warm, funny, “nice” but efficient person is not going to fly.

Perhaps the paradigm shift in the 2016 election will be that “real” trumps “artificial”.

Indian GDP growth figures at 7.5% flatter somewhat – but are not wrong

August 31, 2015

India since the start of this year has been using a new method of calculating GDP and GDP growth. Basically 3 changes have been made.

  1. the base year has been changed from 2004-05 to now be 2011-12
  2. a “cost of production” based method has been changed to be a “market value” based method, and
  3. a database of just 5,000 corporate entities has been expanded to include over 500,000 entities

It is the use of “market value” rather than cost based data which is the biggest change and actually brings India more into line with the methods used by most other countries. Cost based (bottom up) analyses are always historical in nature, somewhat out-of-date by the time the data are used, and under-estimate real value. “Market value” based data should be more current but have a subjective element and can overestimate “value” especially in times of high inflation. The subjective element can work in both directions but brings in an element of “expectation” into what should be a look backwards. For example a calculation of GDP growth for a quarter consists of “value now” minus “value 3 months ago”. A “value now” estimation in times of high growth will overestimate and in hard times will underestimate. On the other hand a cost-based, bottom-up estimation of value will always lag and underestimate real value.

There is no “correct” method. The real question is what the “value now” is to be compared with. To compare with the growth in China or some other country it is better that the methodologies used be the same. Of course, differences of value (growth) will be different using the different methodologies. The “new” method at least uses a large enough database to be more representative of the constituent parts of the Indian economy as it actually is now.

Hindustan TimesAll of this means the new method for computing GDP, which takes 2011-12 (when GDP grew 6.7%) as the base year, has bumped up India’s estimates of growth. In 2012-13, the new formula estimates growth at 5.1% (under the old one, it was 4.5%); in 2013-14, it is 6.9% (the old estimate was 4.7%); and, as we all know by the high-decibel crowing that came in its wake, in 2014-15, it was 7.3%.

There’s obviously no ‘old data’ for 2014-15 but estimates suggest that the old method may have pegged growth at 6.3-6.8%. All of this may mean something else too.

Last week, FM Arun Jaitley told US investors that India could attain double-digit growth soon. He wasn’t kidding. Because what’s 10% now could’ve been just 8% before!

For the April-June quarter Indian GDP growth is estimated to have been 7.4% compared to the 7.5% in the preceding quarter (calculated by the new method). With the old method the number would probably have been about 5.8 – 6.2 %. A growth of 7.5% is somewhat flattering of the real mood in Indian industry that I can discern.

I have a suspicion that at 7.5% the growth figures are a little too high and contain an overly optimistic “market value”. It could be that there is an in-built “optimism” of the politicians and bureaucrats, rather than of industry, which is skewing the “value now”. “Reality”, if such a thing exists, lies somewhere in-between the values calculated by the two methodologies.


Chinese markets dive below ground “zero”

August 25, 2015

I thought that the “bottom” for the Shanghai Composite Index was at about 3100. Yesterday the SCI dropped below 3000.

SCI Aug 25th 2015 Yahoo

SCI Aug 25th 2015 Yahoo

I think Shanghai at 2950 is undervalued now, but I am no longer sanguine about when it might hit a floor and begin to bounce back. The speed of the decline in the last week indicates that even 2500 is not impossible. The risk is that it will drag the global markets down as well.

Perhaps the turnaround can only come when oil price has dropped to $30/barrel?

Oil price destroys viability of Scottish independence

August 24, 2015

The Scottish National Party (SNP) once had budgeted on the basis of oil price being $115/ barrel. Then at the time of the referendum they assumed a price of not less than $100/barrel giving a tax revenue of not less than £7 billion per year which would offset the “subsidy” that Scotland gets from the rest of the UK of about £9 billion per year. This tax revenue drops to zero with a North Sea oil price of less than $50/ barrel.  But the breakeven price for oil producers is even higher:

Forbes (Jan 2015)Some prospects, including almost all activity West of Shetlands, are considered unprofitable below $100 per barrel. Mature oil wells struggle to be viable below $60, so BP has decided that 200 jobs and 100 contractors’ roles would go following a review of its North Sea operations managed out of Aberdeen, Europe’s oil and gas capital. Looking ahead, BP forecasts the oil price to remain in the $50 to $60 price range for next three years. ………

Either way, BP’s take has darkened the mood in the British and Norwegian sectors of the North Sea. However, it isn’t the first to announce job cuts. If anything, BP’s move is pretty predictable given the company has been quite clear about reducing employee headcount.

Shell, Statoil and Chevron have made similar announcements while ConocoPhillips has also been clear about a need to “streamline operations.” As operators downsize, oilfield services companies would invariably feel the pinch from independent upstarts to market leader Schlumberger.

But reality is biting hard. It is now more likely that Brent oil price will be trapped between $30 and $40 for the next 2 -3 years. Costs of production in the North Sea have not come down much compared to the sharp decline in US production costs of oil from fracking. And now Iranian oil will take its market share. At these prices the North Sea oil producers will be losing money on each barrel produced. Production is likely to be scaled down sharply and investment will drop to a trickle. Onshore jobs involved in both exploration and production (Norway, Holland, Scotland) must decrease. The Norwegian and Scottish production will bear the brunt of this turndown. Norway has built up a huge reserve fund and can weather a storm but not a permanent downturn, The UK economy can take the hit but an independent Scotland would be very hard hit. The introduction of shale fracking in England – which could take advantage of the the production cost reductions achieved in the US – could not only mitigate the risk but add a new source of jobs and tax revenue. The largest cost reductions in the production of oil from shale have come in the non-unionised part of the industry. There is considerable oil shale in Scotland as well, but I expect the SNP and the UK unions to be far too short-sighted and to do their damndest to prevent the introduction of fracking.

Nasdaq brent oil 10 year chart Aug 2015

Nasdaq brent oil 10 year chart Aug 2015

At less than $40/barrel, the SNP would need to create some very strange, fantasy budgets to prove the viability of an independent Scotland. Perhaps they could just nationalise everything and print money.

Where’s the bottom for this crash?

August 21, 2015

We are in a crash currently. It is more than just summer doldrums. It may not be as deep and as comprehensive as the 2008 crash but we still have a way to go to hit bottom. Every crash always presents a new investing opportunity (even for pessimists). But it is trying to predict the bottom while the crash is occurring that is difficult. Lagging indicators like gold are not particularly useful.

As a layman investor, I can only try and define parameters which I believe represent the bottom. Of course these parameters are never all met simultaneously and can even seem to be opposed in phase. Finally, any investor will just have to take a call. I find inflation and interest rate movements in different countries too complex and too confusing to be useful as indicators. Inflation is at unhealthily low levels globally but is a very “messy” indicator since countries and regions are not in phase. My expectation is that the markets reaching bottom will coincide with EU inflation having picked up and approaching about 1% (average) – probably by the end of 2016. US and China should exhibit somewhat higher values while inflation in India should still be trending downwards and approaching about 3%. Interest rates in the EU and the US will only pick up once inflation can be seen. In India interest rates are far too high for the prevailing inflation, but the fear of rampant inflation is so high that rates are not being reduced as they should be. I suspect that Indian interest rates will not reduce till after all the “monsoon risk” has passed. That takes us to after October this year.

That leaves me with two “indicators”.

  1. I think the first has to be the Chinese markets (which embodies all the Chinese parameters). Irrespective of what happens elsewhere, the global economy needs the Chinese economy to stabilise and start moving upwards again. The bubble has burst but all the excess has not yet been expelled. The bottom for the Shanghai Composite Index lies at about 3100-3200. That is about 15% lower than current valuations. Because of recent forced share buying activities by the Chinese institutions the market distortions and the Chinese “slowdown” will run till November/ December this year. The Chinese “opportunity” will come when the SCI falls back to the level of the underlying, sans bubble, growth. The current value is just over 3500 (the same as about a month ago).

2. Oil – Oil price is still much too high for the glut that exists. Iran is coming back into the picture and fracking is getting cheaper. Currently WTI is just above $40/barrel with Brent at $45. Any recovery will need the perception that energy costs will be sustainably low. That I think will be when prices are around 20-30% lower than today. Possibly with WTI back to its “traditional value” of $30/ barrel with Brent at about $34.

So I’m looking for the SCI at or less than 3200 and oil prices of about $30/barrel to start getting bullish again. That will not be before November/December this year.

And until then its probably best to keep cash under the mattress.

Half-way through, Indian monsoon on course to be close to “normal”

July 31, 2015

Compared to “normal” the Indian monsoon has a large downside and a limited upside. It is thought that a “bad” monsoon (accumulated rainfall 20% less than normal) can depress GDP by 2 percentage points. A “good” monsoon (20% greater than normal) however can raise GDP by only about 1 percentage point since the benefits are capped by areas of local flooding. The monsoon lasts 4 months (June – September) but its indirect effects are felt all the way through to the start of the next monsoon. Agriculture contributes only 17% of India’s GDP directly but agriculture employs almost 65% of the Indian work-force.

Indian Economy

The immediate impact of a good monsoon is increased employment in rural areas (September – October) followed by increased rural consumption of consumer goods (October – December) and even sales of two-wheelers and tractors (November – March). Pesticide sales increase during the monsoon and again in the following pre-monsoon period. Fertiliser sales pick-up strongly in the pre-monsoon period following a good monsoon. The December – June period following a good monsoon is when rural “investments” are mainly made (machinery, equipment, construction, consumer goods). The indirect effects of agriculture on the services and manufacturing sectors are critical. However, even more important is the effect of a good monsoon on food price stability and general economic sentiment.

The current monsoon is now half-way through. June saw accumulated rainfall about 15% higher than normal while July has seen a shortfall of about 16%. For the 2 months the accumulated rainfall is now just short of “normal”. Revised forecasts are for a small shortfall during August followed by some excess in September and for the whole period rainfall to be close to “normal”. Timing of rainfall is important but the rains have kept reasonably close to the expected time-line.

The potential downside of a “bad” monsoon seems to have evaporated. My conclusion is that India should see a strong growth period in the September 2015 – May 2016 period, as the Modi government’s sluggish reforms pick up some steam and as the seasonal effects of a near-normal monsoon trickle through the economy.