Archive for the ‘Water’ Category

Fresh water is globally abundant but often locally mismanaged

October 7, 2017

Summary

There is no global water shortage. In many places, the scarcity that exists is caused by bad local planning and inadequate storage and distribution, but there is no global shortage. Variable climate and weather and “natural” catastrophes are often blamed, but wherever scarcity is experienced, it is a lack of planning and/or unbridled expansion and/or a profligate use of available resources which is the real cause.


Abundance or scarcity

Alarmist organisations tend to paint a bleak future:

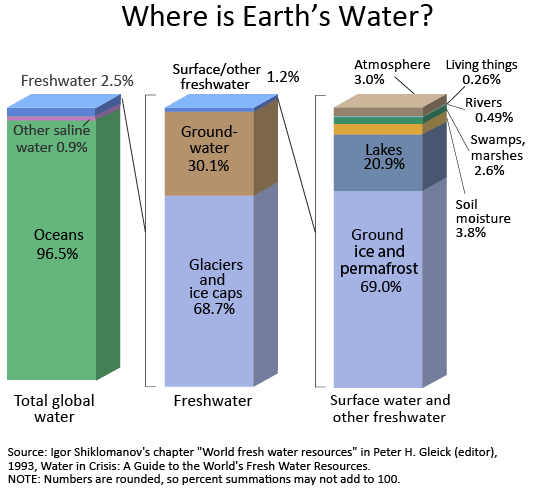
WWF: Only 3% of the world’s water is fresh water, and two-thirds of that is tucked away in frozen glaciers or otherwise unavailable for our use. As a result, some 1.1 billion people worldwide lack access to water, and a total of 2.7 billion find water scarce for at least one month of the year.

This is a false picture. Just one third of the “3% of the world’s water” is actually equivalent to over one million years of water at current utilisation levels. The amount of global fresh water is not a cause of any scarcity.

More importantly, what they fail to mention is that all human activities use just 0.01% (one ten thousandth) of the annual precipitation just over land. It is not that scarcities don’t exist but they exist mainly because of inadequate planning, mismanagement, incompetence and plain stupidity among those affected. Local resources are grossly overstretched or adequate storage is not planned for by the societies affected. Urban areas expand without planning and exhaust the easily accessible ground water resources available. Rainwater is not harnessed locally. Distribution is ignored. Rivers are polluted upstream. Ignoring common sense has consequences. Often this rank stupidity is at the local community or national government level. The problems are local and the solutions are local. It is easier for local bodies to demand some all encompassing solutions to their problems. But this is a red herring to divert responsibility away from the local incompetence.

Water scarcities are much more due to the local non-application of intelligence than any global or climate or weather events.


Water on Earth

The quantity of water on earth has been pretty constant for about 4 billion years. All the water on earth can be accounted for as 3 main categories

  1. that trapped in molten rocks,
  2. saline water and
  3. “fresh” water.

In the most part water on earth is neither created nor destroyed. Fresh water is essential for human activity. Human activity does not, though, destroy water. A relatively miniscule amount of water is created by combustion processes and bio-degradation processes. But human activity does contaminate “fresh” water and makes for an extra stop for the precipitation over land as it finds its way back to the oceans. It does therefore add some time delays to a small quantity of water within the “normal” water cycle. Human activity requires “fresh” rather than saline water but all global activity uses less than 10×1012 kg/year. Almost 92% of this is for agricultural use (crops, pasture and animals), around 4% for industrial use and less than 4% for domestic use.

The primary – and overwhelmingly dominant source – of fresh water is precipitation (rain, snow, sleet, hail, fog, dew …) from the atmosphere. Global precipitation gives about 506×1015 kg/year, but most of this is over the oceans. Just over the land mass of the earth, precipitation gives about 108×1015 kg/year of fresh water. All human activity thus uses only about 0.01% (one ten thousandth) of the precipitation that occurs just over land. Fresh water scarcity is clearly non-existent at a global level and when averaged over time. Scarcities – and some severe scarcities – occur locally, at certain times. At any instant in time (average) the atmosphere holds about 12.6×10¹⁵ kg (12.6 P kg) which itself represents about 1300 years of total human consumption. (With a total precipitation rate of 506×1015 kg/year, water has a residence time in the atmosphere of only about 9 days). It is not, therefore, that the atmosphere, acting as a global reservoir, holds too little which is the cause of the local scarcities. Global reservoirs of fresh, ground water (under the surface in liquid form) amount to 10×1018 kg which is about 1 million years of human utilisation. But these reservoirs are not evenly spread around the world and some are much deeper and less accessible than others. Lakes and swamps and rivers hold some 100×1015 kg of fresh water which represents about 10,000 years of human utilisation. The global capacity of fresh water reservoirs on the surface (10,000 years) and of ground water (1 million years) pose no limitations on human utilisation. The geographical location of these and the seasonal nature of their flows can and do place limits and that, in turn, when combined with a dearth of common sense, leads to local scarcities.

When we include all the water thought to be trapped in the earth’s mantle, we don’t really know how much water there is on earth . We don’t really know how the water got to earth in the first place either. Unlike hydrogen, water vapour in the earth’s atmosphere does not leak out into space. Some surface water is continuously lost into the earth’s interior as tectonic plate movement leads to subduction of land mass. Equally some water from the earth’s crust reaches the surface by volcanic eruptions where degassing of hydroxyl radicals (OH) trapped within molten rocks is released. It is thought that the mass of water on earth has remained virtually constant for billions of years. Very little water is “destroyed” by decomposition into hydrogen and oxygen and very little is “created” (primarily by combustion of hydrocarbons).

How the water came to be on earth is a matter of speculation. It could have been there in the original mix as elemental hydrogen and oxygen which later combined and was then trapped in molten rock. It may have been brought to the earth’s surface as the earth cooled and violent volcanic or tectonic activity brought degassing molten rocks to the surface. Or it could have come from some icy comets or asteroids or meteors which collided with the earth in its infancy. Studies of some zircons indicate that water was present on earth as far back as 4 billion years ago (with the earth’s formation put at 4.5 billion years ago).

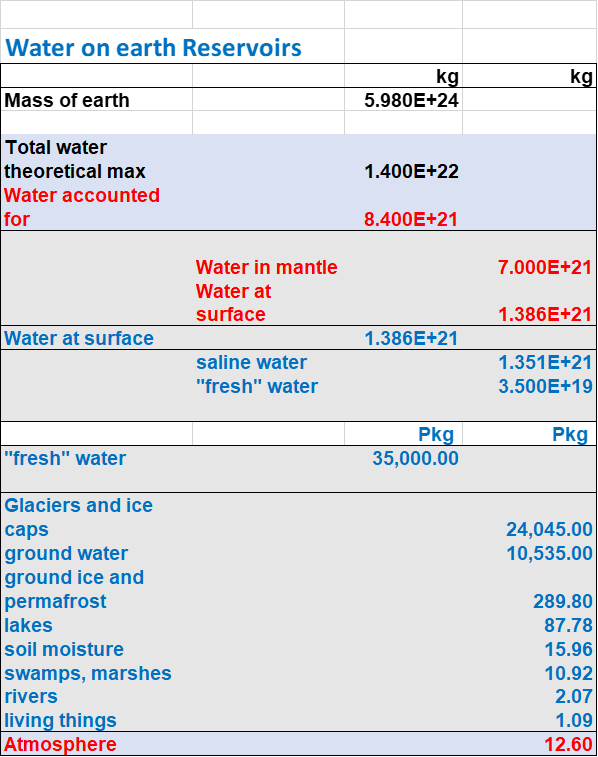
The mass of the Earth is estimated to be 5.98×1024 kg (5.98 Yotta kg). Hydrogen needs eight times its own mass of oxygen to make water. On earth the amount of oxygen available is far in excess of that needed to convert all the available hydrogen to water. Water on earth is thus limited by hydrogen rather than oxygen. Just 0.8% of the oxygen present on earth would be sufficient to convert all the available hydrogen (260 ppm of the earth’s mass) to water. If all the available hydrogen could be converted into water we could theoretically have 14×1021 kg of water.  We can account for about 8.4×10²¹ kg which is 60% of the theoretical maximum. Around 85% (as a crude estimate) lies in the deep mantle and 15% at or near the earth’s surface.

Water at or near the surface, in all its forms (including atmospheric water but excluding water in the mantle), is estimated to have a mass of 1.386×10²¹ kg (1.386x 10⁹ cubic kilometers). However about five times that (estimated range is from 2 to 10 times ) is possibly held in the mantle within molten rocks. Of the total  surface water about 97.5% is salt water and only 2.5% is fresh water (35×1018 kg). The fresh water “storage capacity” is mainly in solid form (ice sheets, glaciers) and accounts for about 68.7% of the fresh water (24×1018 kg). The remainder is mainly ground water (10.5×10¹⁸ kg) with about 0.4×10¹⁸ kg as fresh water on the earth’s surface. Around 69% of this surface fresh water is in the form of ice and permafrost and not readily accessible. Lakes and swamps and rivers hold some 100×1015 kg. The water held in all living matter only accounts for about 1.1×10¹⁵ kg.

Water reservoirs on earth

1 Peta kg (P kg) = 1015 kg

The Water cycle

It is not just the size of the global reservoirs that matters. More important for human utilisation are the flows making up the water cycle. The dominant loop is the manner in which fresh water enters the atmosphere and then returns to earth. The saline water of the oceans covering some 70% of the earth’s surface is converted to fresh water mainly by evaporation but also by freezing (mainly near the poles). Only the evaporation is of significance for water entering the atmosphere. Ice does sublime and contribute to the water input to the atmosphere but this amount is minuscule compared to the evaporation from the ocean surfaces. Over the earth’s land mass, water enters the atmosphere by evaporation from the soil and open water surfaces. A very small amount is also transferred by transpiration from living things.

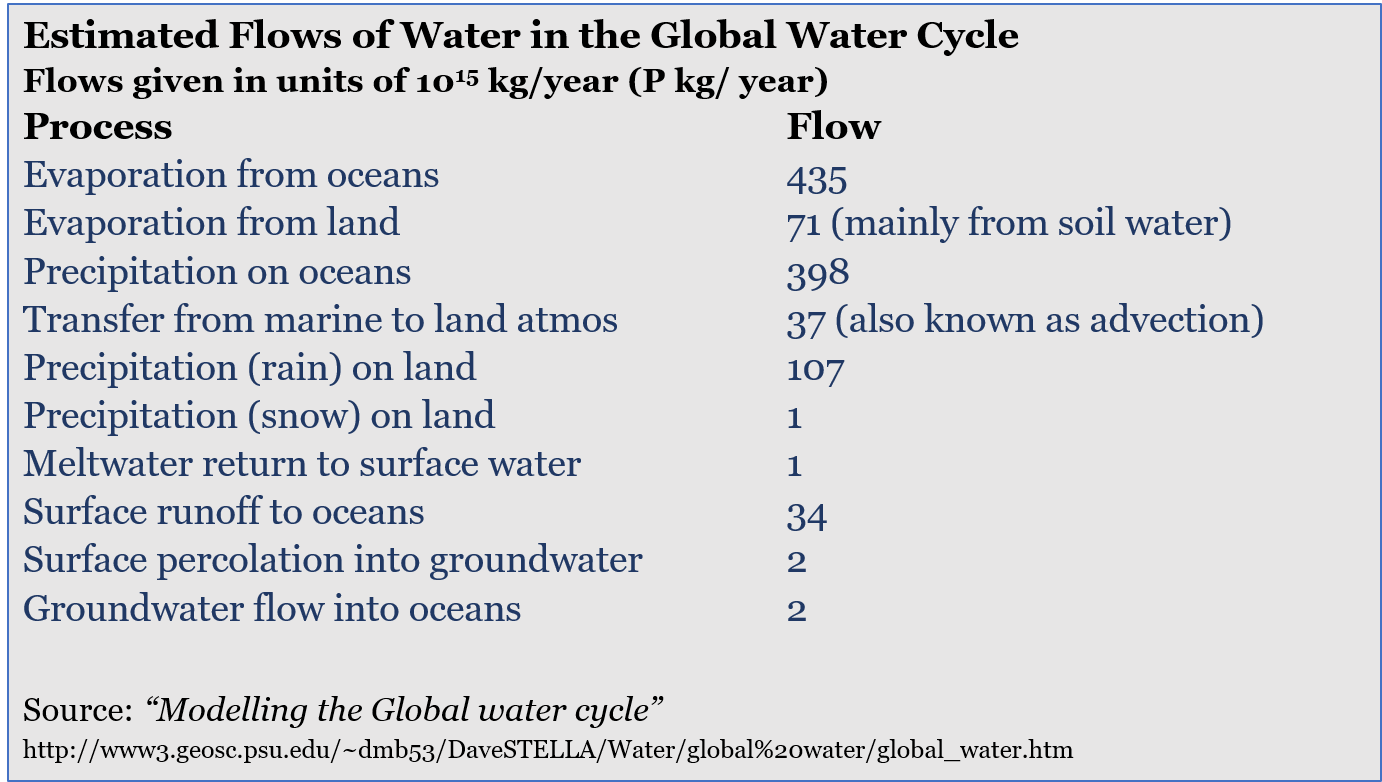
Human consumption hardly shows up in the big picture of the water cycle. Of the precipitation which falls on land 70% is re-evaporated. About 2% goes into ground water and thence to the ocean. The remaining 28% returns to the ocean as surface water run-off. The human part which is only about 0.01% of the precipitation on land is just a small side loop in the surface water run-off section and an insignificant loop in the ground water part of the cycle.

Consumption and scarcity

The water footprint of humanity

The WF of the global average consumer was 1,385 m3/y. The average consumer in the United States has a WF of 2,842 m3/y, whereas the average citizens in China and India have WFs of 1,071 and 1,089 m3/y, respectively. Consumption of cereal products gives the largest contribution to the WF of the average consumer (27%), followed by meat (22%) and milk products (7%). 

Human “consumption” today, with a population of 7.1 billion, comprises of about 9.2×10¹² kg/year for agriculture and domestic animals, 0.45×10¹² kg/year for industrial use and about 0.35×10¹² kg/year for domestic use. (10×1012 kg/year in total). Around 1.5 billion humans are subject to scarcities. If we add an additional 30% utilisation (to give a total of 13×1012 kg/year), at the right times and in the right places, it would suffice to eliminate all scarcities. Further suppose that global population increased to around 10 billion by 2100. To avoid scarcities, utilisation would then need to be ramped up to 18.5×10¹² kg/year. Precipitation over land would still be about 6,000 times greater than this need. The run-off through lakes and rivers into the oceans would represent about 2,000 times the desired human consumption. Even with the increased utilisation, the global capacity of fresh water reservoirs on the surface (6,000 years) and of ground water (600,000 years) would pose no limitations on human utilisation.


Conclusion

There is no shortage of water. Fresh water scarcities are not a problem of global or temporal availability but essentially of local acquisition, storage and distribution. The solution lies locally – not in grandiose global campaigns. The solutions are relatively simple – but not necessarily inexpensive – but require intelligent planning and implementation of local acquisition, distribution and storage. 


Sources

EarthComposition

http://www.pnas.org/content/109/9/3232.full

http://www.pnas.org/content/109/9/3232/T1.expansion.html

https://water.usgs.gov/edu/watercycleatmosphere.html

https://www.astrobio.net/news-exclusive/scientists-detect-evidence-oceans-worth-water-earths-mantle/

http://www3.geosc.psu.edu/~dmb53/DaveSTELLA/Water/global%20water/global_water.htm

https://nsidc.org/cryosphere/seaice/index.html

https://en.wikipedia.org/wiki/Water_cycle

https://en.wikipedia.org/wiki/Origin_of_water_on_Earth

https://en.wikipedia.org/wiki/Abundance_of_the_chemical_elements#cite_note-mit1-14

https://en.wikipedia.org/wiki/Water_distribution_on_Earth


China to industrialise desalination of sea-ice

January 16, 2014

During an ice age as water gets trapped in expanding ice, the entire water cycle stabilises at much lower rates of flux than during an inter-glacial period. Evaporation (due to absorption of solar energy) is the primary force which drives the water cycle. During an ice age, rates of evaporation will decrease sharply, precipitation will reduce and the flow of fresh water through rivers and streams back into the seas will reduce as a consequence. Sea levels would drop by up to 150 m from current levels and while currently submerged land will be exposed, desertification of many regions will also take place.

One of the technologies that will be necessary at such a time will be for the extraction of fresh water from sea ice.

Bohai Bay China

Bohai Bay China

The Bohai Rim is one of the water-scarce regions in China. But every winter, more than 1 billion m3 of sea ice formed in the sea, about 40% of which distributes within 10 km offshore and is expected to be exploited and utilized as source of freshwater.

They may not be expecting a return to full glacial conditions anytime soon, but perhaps the Chinese are already preparing for another Little Ice Age and the fresh water availability reduction that will undoubtedly cause.

Xinhua reports:

China will soon begin production of large amounts of fresh water through the desalination of sea ice, according university research team and a Chinese company on Tuesday. A research team from Beijing Normal University signed a sea ice desalination technology transfer agreement with Beijing Huahaideyuan Technology Co. Ltd on Tuesday.

The company is expected to be able to produce at least 1 billion cubic meters of fresh water annually by 2023, said Yu Jian, executive president of the company. The salinity of sea ice is between 0.4 percent to 0.8 percent, much lower than that of sea water, which stands at about 2.8 percent to 3.1 percent, said Professor Gu Wei, head of the research team.

The research team has mastered the basic principles and technology of sea ice desalination and developed the equipment to be used in the process, including an ice-breaking platform and an ice-gatherer, he said. The salinity of sea ice water after desalination is 0.1 percent, which meets the national standard. The water can be used in agriculture, by industry and for drinking, he said.

The cost of desalination is expected to fall to 4 yuan per tonne, he said.

China’s sea ice desalination program started in 1996 when Shi Peijun, a professor from Beijing Normal University, realized that low saline ice could ease the water shortage around the Pan-Bohai Bay area in north China, after desalination. The program has received a total of 29.72 million yuan (4.88 million U.S. dollars) from various government departments in the past 18 years.

In winter in high-latitude oceans, there is a great amount of sea ice, which is being recognized as a new resource of fresh water by scientists.

At least 275 water molecules needed to form an ice crystal

September 24, 2012


In idle moments I contemplate on strange things such as the origins of water on earth (which is largely unknown) and the life-span of water molecules (in the order of milliseconds) and the manner  in which water molecules are added to or lost from the apparently constant amount of water on earth. None of these questions are illuminated further but this interesting paper by researchers in Germany and the Czech Republic describes a technique for studying clusters of water molecules and provides some answers on the formation of ice crystals.

A Fully Size-Resolved Perspective on the Crystallization of Water Clusters by Christoph C. Pradzynski, Richard M. Forck, Thomas Zeuch, Petr Slavíček, Udo Buck . Science 21 September 2012:
Vol. 337 no. 6101 pp. 1529-1532 DOI: 10.1126/science.1225468

ABSTRACT

The number of water molecules needed to form the smallest ice crystals has proven challenging to pinpoint experimentally. This information would help to better understand the hydrogen-bonding interactions that account for the macroscopic properties of water. Here, we report infrared (IR) spectra of precisely size-selected (H2O)n clusters, with n ranging from 85 to 475; sodium doping and associated IR excitation–modulated photoionization spectroscopy allowed the study of this previously intractable size domain. Spectral features indicating the onset of crystallization are first observed for n = 275 ± 25; for n = 475 ± 25, the well-known band of crystalline ice around 3200 cm−1 dominates the OH-stretching region. The applied method has the potential to push size-resolved IR spectroscopy of neutral clusters more broadly to the 100- to 1000-molecule range, in which many solvents start to manifest condensed phase properties.

Illustrations of the molecular structure of three water clusters

Illustrations of the molecular structure of three water clusters : from http://physicsworld.com/cws/article/news/2012/sep/21/how-many-water-molecules-does-it-take-to-make-ice


Murray Darling basin is 87% full, La Niña is back and floods and fires are on the agenda

October 10, 2011
The "Mighty Murray", the longest riv...

The "Mighty Murray": Image via Wikipedia

After a decade of drought and two very wet years Australia is facing a third consecutive wet year. La Niña is back and the Murray Darling basin is already 87% full as of 23rd September. Last year levels were the highest since 2001 and this year they are even higher.

Water levels are high across all of Australia except in the West. The ground is also reported well saturated and as the rains come the controlled release of water from the dams system will be crucial to prevent a repeat of this year’s floods in January and February 2012.

The Australian writes:

… if the spring rains continue, the water storage that is so vital to the prosperity of irrigation farmers along the Murray River and to Adelaide’s drinking water supply, will be full by next year. Around the nation, water storage reserves are at levels not seen since the start of the decade-long drought in the late 90s.

The Bureau of Meteorology estimates Australia’s 261 largest drinking water and irrigation storages, with a total capacity of 78 million megalitres of water, are on average 80 per cent full. This time last year, the figure was 65 per cent. 

Drinking water supplies for the major cities have been replenished by the wettest 10-month period ever recorded, between July last year and April. Sydney’s city water storages are now 79 per cent full, while dams supplying Adelaide and Brisbane are at a healthy 83 per cent capacity. Even Melbourne’s once critically low dams have climbed to 63 per cent full with recent rainfall, their highest levels in 12 years. Melbourne’s largest supply dam, the Thomson, is this week half-full for the first time since 2005.

The anomaly is Perth, which is still critically dry, relying on desalination plants and aquifers for 60 per cent of its water supplies. ….. 

… The filling of the giant Dartmouth Dam is an extraordinary feat that has happened just three times since the vast reservoir in the remote Victorian high country was commissioned in 1980. Only in 1990, 1993 and 1997 has water overflowed from the four-million-megalitre dam and thundered down its 180m drop spillway. It’s a far cry from this time last year, when the Dartmouth Dam was just 26 per cent full. Now holding 2.8 million ML of water, according to operators Goulburn-Murray Water, it’s a rejuvenation that has tourists, anglers and irrigation farmers flocking to enjoy the dam’s beauty and plentiful trout.

The level in the Dartmouth Dam is so high that irrigation needs for farmers downstream are assured for about 4 years. But the risk of flooding is being closely watched

La Niña has become synonymous with flooding as a result of above average rainfall. This year is likely to see a re-emergence of both but on a smaller scale than last year. “Above average rain through northern and eastern Australia is likely to once again prompt broad-scale flooding. Areas which will see a return of above average rain include; Queensland, the Northern Territory, northern parts of Western Australia, north-east parts of South Australia, much of New South Wales and northern Victoria,” says Dick Whitaker, Chief Meteorologist at The Weather Channel.

…. The Australian cyclone season runs from November to April and The Weather Channel expects a more active season compared to last year. “This year is likely to be a more active season than last year when despite strong La Niña conditions we saw only 11 cyclones. We are expecting a total of around 12 to 13 cyclones this year in Australian waters, but on average only half of our cyclones actually cross the coast,” says Tom Saunders, Senior Meteorologist at The Weather Channel.

“About 5-6 cyclones can be expected off the north-west coast of Western Australia and two of these should cross the coast, one of which is likely to be severe (category 3 or above),” he continues. “Off the Queensland coast, 4-5 tropical cyclones are likely, with one or two coastal crossings. While off the north coast between the Kimberley and Cape York Peninsula, four cyclones are likely, three of which should cross the coast,” Saunders continues.

“If La Niña conditions strengthen over the next few months as predicted by some models we may add one or two more cyclones to the forecast for each region,” says Saunders.

Paradoxically, “the heavy rains last year have pushed the nation’s grassfire risk to levels not seen in 40 years, with an area in central Australia twice the size of Tasmania having burned since June”.


Yellow River freezes early

December 29, 2010

China’s Yellow River has frozen up to 677 kilometers in Inner Mongolia so far. The freezing is more typical of mid-to-late January. Preventive work has been organised for possible ice damage.

http://news.xinhuanet.com/english2010/photo/2010-12/29/c_13669452.htm

Dec. 29, 2010 Frozen Yellow River at Sanshenggong Water Project. (Xinhua/Li Yunping)

Recent strong cold air made Yellow River freeze up quickly in Shandong as the flow decreased in lower Yellow River.

December 29th 2010. Floating ice on Yellow River in Jinan, capital of east China's Shandong Province. (Xinhua/Guo Xulei)

Evaporation from land increased from 1982 to 1998 and then stopped

October 10, 2010

Interesting paper but the headlines it generates are even more interesting.

A new Letter to  Nature:

Recent decline in the global land evapotranspiration trend due to limited moisture supply

Martin Jung et al, NatureDOI:10.1038/nature09396

The authors write:

Our results suggest that global annual evapotranspiration increased on average by 7.1 ± 1.0 millimetres per year per decade from 1982 to 1997. After that, coincident with the last major El Niño event in 1998, the global evapotranspiration increase seems to have ceased until 2008. This change was driven primarily by moisture limitation in the Southern Hemisphere, particularly Africa and Australia.

But the New Scientist in its wisdom reports this under the headline:

Water cycle goes bust as the world gets warmer

That evapotranspiration should decrease if the moisture is not there in the first place seems perfectly reasonable.  That we will have to use technology to get ground water levels back up as water usage increases is also fairly obvious.

It occurs to me that global temperatures have been stable if not declining over the last decade which also fits the period when they measured the stable evapotranspiration.

I note – in passing – that evaporation from ocean surfaces is some 7 times greater than the evaporation from land surfaces while precipitation over the oceans is about 4 times greater than that over land.

But the NS headline is a little bizarre.


%d bloggers like this: