Posts Tagged ‘carbon dioxide’

Carbon dioxide concentration was at 500+ ppm already in 1860

May 13, 2013

This has been around for some time, but I have only just come across it.

It could be that GS Callendar’s 1957 paper about Global warming  cherry picked supportive data points and ignored inconvenient data.

Reblogged from JunkScience

Did one of the fathers of manmade global warming cherry-pick his data for a 1957 study?

Here’s the original data.

Source: Slocum, G., Has the amount of carbon dioxide in the atmosphere changed significantly since the beginning of the twentieth century? Month. Weather Rev., 1955(October): p. 225-231.

Source: Slocum, G., Has the amount of carbon dioxide in the atmosphere changed significantly since the beginning of the twentieth century? Month. Weather Rev., 1955(October): p. 225-231. 

Here’s the cherry-picked version.

Callendar graph

Read the full story at Tallbloke’s blog.

Related:

slocum 1955 carbon dioxide Slocum, G., Has the amount of carbon dioxide in the atmosphere changed significantly since the beginning of the twentieth century? Month. Weather Rev., 1955(October): p. 225-231. 

Climate Change: Incorrect information on pre-industrial CO2

CO2: The Greatest Scientific Scandal of Our Time


Unchanged seasonal variation shows that Carbon dioxide concentration increase is probably not due to fossil fuel combustion

May 5, 2013

Carbon dioxide concentration in the atmosphere varies seasonally with the May peak being about 6 ppm higher than the October low. These are very regular and are a reflection of biogenic and chemical interactions from plants, the soil and the oceans

This concentration is the net result following all the mechanisms by which carbon dioxide is produced and absorbed. Since 1960 the mean concentration has risen about 25% from about 320 ppm to just under 400 ppm now (399 as of yesterday) but the seasonal variation has remained virtually unchanged during this time.

from wikipedia

from wikipedia

This is not new and analyses the 25 year period from 1997 but I have only just come across it.

SOURCES AND SINKS OF CARBON DIOXIDE

CO2 seasonal variation

CO2 seasonal variation

The constancy of seasonal variations in CO2 and the lack of time delays between the hemispheres suggest that fossil fuel derived CO2 is almost totally absorbed locally in the year it is emitted. This implies that natural variability of the climate is the prime cause of increasing CO2, not the emissions of CO2 from the use of fossil fuels.

The annual increase of CO2 in the atmosphere is in sharp contrast with the annual change in the seasonal variations (last 25 years)

The mean values are:
Annual CO2 increase = 1.572 ± 0.013 ppm per year
Seasonal CO2 increase = -0.001 ± 0.013 ppm per year

The general assumption is that about 40% of man-made carbon dioxide shows up as this increase with the remainder being absorbed by the enhanced action of sinks.

The justification for this conclusion is supported by measurements of the falling proportion of  13C  in the atmosphere which is taken to signal the appearance of CO2 from fossil fuel emissions. …… 

The correlation of changes in δ13C with ENSO events and the comparison with a simple model of a series of cascades suggest that the changes in δ13C in the atmosphere have little to do with the input of CO2 emissions from the continuous use of fossil fuels.

Even though the combustion of fossil fuels only contributes less than 4% of total carbon dioxide production (about 26Gt/year of 800+GT/year), it is usually assumed that the sinks available balance the natural sources and that the carbon dioxide concentration – without the effects of man – would be largely in equilibrium.  (Why carbon dioxide concentration should not vary naturally escapes me!). It seems rather illogical to me to claim that sinks can somehow distinguish the source of carbon dioxide in the atmosphere and preferentially choose to absorb natural emissions and reject anthropogenic emissions! Also, there is no sink where the absorption rate would not increase with concentration.

Carbon dioxide emission sources (GT CO2/year)

  • Transpiration 440
  • Release from oceans 330
  • Fossil fuel combustion 26
  • Changing land use 6
  • Volcanoes and weathering 1

Carbon dioxide is accumulating in the atmosphere by about 15 GT CO2/ year. The accuracy of the amounts of carbon dioxide emitted by transpiration and by the oceans is no better than about 2 – 3% and that error band (+/- 20GT/year)  is itself almost as large as the total amount of emissions from fossil fuels.

SOURCES AND SINKS OF CARBON DIOXIDE

Conclusions:

During the 1977 to 2001 time period analysed:
Changes in the isotope ratio are discontinuous. The temporal peaks in 13C appear to correlate with the CO2 concentration changes. Further the temporal peaks in 13C and the CO2 peaks correlate with ENSO events.
The yearly increases of atmospheric CO2 concentrations have been nearly two orders of magnitude greater than the change to seasonal variation which implies that the fossil fuel derived CO2 is almost totally absorbed locally in the year that it is emitted.
A time comparison of the SIO measurements of CO2 at Mauna Loa with the South Pole shows a lack of time delay for CO2 variations between the hemispheres that suggests a global or equatorial source of increasing CO2. The time comparison of 13C measurements suggest the Southern Hemisphere is the source. This does not favour the fossil fuel emissions of the Northern Hemisphere being responsible for ther observed increases.
All three approaches suggest that the increase of CO2 in the atmosphere may not be from the CO2 derived from fossil fuels. The 13C data is the most striking result and the other two approaches simply support the conclusion of the first approach.

Disconnect between man-made CO2 and atmospheric levels of CO2

April 28, 2013

The evidence grows that

  1. Temperature drives carbon dioxide, and 
  2. man made carbon dioxide is a minor contributor to carbon dioxide concentration in the atmosphere

Atmospheric verification of anthropogenic CO2emission trendsRoger J. Francey et al, Nature Climate Change 3, 520–524 (2013) doi:10.1038/nclimate1817

The Hockey Schtick reports:

A recent paper published in Nature Climate Change finds a disconnect between man-made CO2 and atmospheric levels of CO2, demonstrating that despite a sharp 25% increase in man-made CO2 emissions since 2003, the growth rate in atmospheric CO2 has slowed sharply since 2002/2003. The data shows that while the growth rate of man-made emissions was relatively stable from 1990-2003, the growth rate of atmospheric CO2 surged up to the record El Nino of 1997-1998. Conversely, growth in man-made emissions surged ~25% from 2003-2011, but the growth rate of atmospheric CO2 has flatlined since 1999 along with global temperatures. The data demonstrates temperature drives CO2 levels due to ocean outgassing, man-made CO2 does not drive temperature, and that man is not the primary cause of the rise in CO2 levels.

Climate forcing: Missing water must be hiding in the deep ocean

April 19, 2013

Clive Best points out that NASA data shows quite clearly that water vapour in the atmosphere has been decreasing quite significantly especially since about 1998 while carbon dioxide has continued rising. All the wonderful climate models (settled science after all) take it for granted that increased water vapour in the atmosphere is a key forcing caused by increasing carbon dioxode.

I wonder where the water went?

Presumably hiding along with all the missing heat in the deep oceans!

And causing the sea level to increase no doubt.

The fact is that we can’t account for the lack of water in the atmosphere and it is a travesty that we can’t.

H2O decreasing while CO2 rises !

Posted on April 18, 2013 by Clive Best

Dire predictions of global warming all  rely on positive feedback from  water vapor. The argument goes that as surface temperatures rise so  more water will evaporate from the oceans thereby amplifying temperatures because H2O itself is a strong GHG.  Climate models all assume net amplification factors of between 1.5 and 6. But in the real world has the water content of the atmosphere actually been increasing as predicted?

NASA have just released their latest NVAP-M  survey of global  water content derived from satellite data and radio-sondes over the period from 1988 to 2009. This new data is explicitly intended for climate studies . So lets take a look at the comparison between actual NVAP-M atmospheric H2O levels and those of CO2 as measured at Mauna Loa. I have extracted all the daily measurement NVAP-M data and then calculated the global average. Figure 1 shows the running 30 day average of all the daily data recorde between 1988 and 2009 inclusive. The 365 day (yearly) running average is also shown. Plotted on the right hand scale are the Mauna Loa CO2 concentration data in red over the same period.

Fig1: Total precipitative H2O (running 30 day average) compared to Mauna Loa CO2 data in red. The central black curve is a running 365 day average.

Fig1: Total precipitative H2O (running 30 day average) compared to Mauna Loa CO2 data in red. The central black curve is a running 365 day average.

There is indeed some correlation in the data from 1988 until 1998, but thereafter the two trends diverge dramatically. Total atmospheric water content actually falls despite a relentless slow rise in CO2. This fall in atmospheric H2O also coincides with the observed and now widely accepted stalling of global temperatures over the last 16 years. All climate models (that I am aware of) predict exactly the opposite, so something is clearly amiss with theory. Is it not now time for “consensus” climate scientists perhaps to have a rethink ?

more to follow…

  1. My thanks to Ken Gregory for help with the  data. The conversion from NetCDF was a bit of a nightmare !
  2. NASA NVAP-M data is available here. Thanks to NASA Water Vapor Project-Measures (NVAP-M) team.

Anthony Watts in a comment does point out that sensor degradation or failure would need to be eliminated. (But I wonder why sensor integrity would not have been checked by NASA before the data was published as data)

Are global warmists preparing exit strategies?

March 28, 2013

Are global warmists preparing their arguments so that they can have exit strategies ready for when they have to abandon the global warming religion?

The purpose of an exit strategy is – as a minimum – to save face and minimise losses. In the best case it ends an engagement while realising potential benefits and protecting past gains. This is common enough in – and a necessary part of  – business and military planning. Politicians – at least the skilled ones – always have exit strategies in place when they choose to follow a particular “path of principle”. It is less likely that ideologues or religious leaders have prepared exits from dogmatic positions. However even they do have to change their colours from time to time. (Fanatics of course are not permitted exit strategies. They are expected to fall on their swords and die for their cause).

To escape from a discredited or outdated or bankrupt “faith-based” dogma usually requires some strong, visible reason for leaving a dogmatic position. A divine “revelation” is best though “new data” or  just “seeing the light” are also acceptable. This provides both a new faith as a destination and a reason for leaving the current position. A good exit strategy will also include a high profile “conversion” from one faith to another such that much credit can accrue, first for an”honourable” mea culpa for having followed the wrong path and then for the “principled and difficult” shift to the new path! Damage control may also require that the new converts repudiate their former “brothers of the faith”. In fact it is often “converts” who become the most fanatical about their new “religion”. The success of an exit strategy can be judged by how much baggage or stigma the ideologue or politician can avoid after the conversion.

James Hansen has been one of the most vocal and active proponents of the global warming hypothesis that it is caused by man-made emissions of carbon dioxide. He has been seen as one of the high priests of the global warming religion and qualifies as an ideologue:

Hansen is best known for his research in the field of climatology, his testimony on climate change to congressional committees in 1988 that helped raise broad awareness of global warming, and his advocacy of action to avoid dangerous climate change. In recent years, Hansen has become an activist for action to mitigate the effects of climate change, which on a few occasions has led to his arrest.

But he has a new (open access)  paper which makes me wonder whether he is preparing a position for the execution of an exit strategy when it becomes necessary.  He now admits that less of human made CO2 is entering the atmosphere than it should but that it is due to the increased use of coal which has increased aerosol particulates. He argues that this short term masking by aerosols of global warming will eventually have to appear and his doomsday messages have not changed. But he is adjusting his arguments quite fundamentally to account for the real life observations which he can no longer ignore. The “fertlisation of the biosphere” to account for man-made carbon dioxide not entering the atmosphere sounds a lot like back-pedalling to me. That the biosphere feeds on and relishes carbon dioxide is obvious. It does not much care  where it comes from.

James Hansen et al 2013 Environ. Res. Lett. 8 011006 doi:10.1088/1748-9326/8/1/011006

Climate forcing growth rates: doubling down on our Faustian bargain

As The Hockey Schtick reports some of the contents are startling – coming from Hansen:

  • the effect [forcing] of man-made greenhouse gas emissions has fallen below IPCC projections, despite an increase in man-made CO2 emissions exceeding IPCC projections
  • the growth rate of the greenhouse gas forcing has “remained below the peak values reached in the 1970s and early 1980s, has been relatively stable for about 20 years, and is falling below IPCC (2001) scenarios (figure 5).”
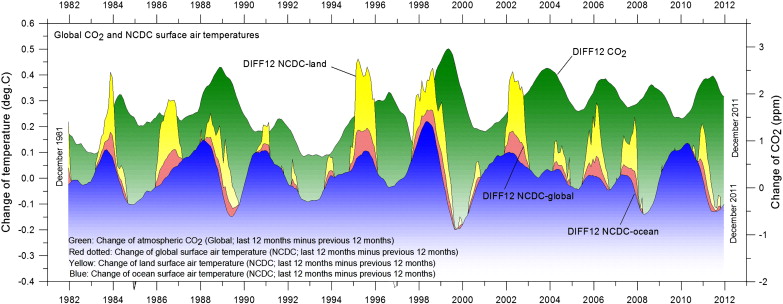
  • the airborne fraction of CO2 [the ratio of observed atmospheric CO2 increase to fossil fuel CO2 emissions] has decreased over the past 50 years [figure 3], especially after the year 2000
  • Hansen believes the explanation for this conundrum is CO2 fertilization of the biosphere from “the surge of fossil fuel use, mainly coal.”
  • “the surge of fossil fuel emissions, especially from coal burning, along with the increasing atmospheric CO2 level is ‘fertilizing’ the biosphere, and thus limiting the growth of atmospheric CO2.”
  • “the rate of global warming seems to be less this decade than it has been during the prior quarter century”

From the paper:

The simple Keeling airborne fraction, clearly, is not increasing (figure 3). Thus the net ocean plus terrestrial sink for carbon emissions has increased by a factor of 3–4 since 1958, accommodating the emissions increase by that factor.

Figure 3.

Figure 3. Fossil fuel CO2 emissions (left scale) and airborne fraction, i.e., the ratio of observed atmospheric CO2 increase to fossil fuel CO2 emissions. Final three points are 5-, 3- and 1-year means.

Remarkably, and we will argue importantly, the airborne fraction has declined since 2000 (figure 3) during a period without any large volcanic eruptions. The 7-year running mean of the airborne fraction had remained close to 60% up to 2000, except for the period affected by Pinatubo. The airborne fraction is affected by factors other than the efficiency of carbon sinks, most notably by changes in the rate of fossil fuel emissions (Gloor et al 2010). However, it is the dependence of the airborne fraction on fossil fuel emission rate that makes the post-2000 downturn of the airborne fraction particularly striking. The change of emission rate in 2000 from 1.5% yr-1 to 3.1% yr-1 (figure 1), other things being equal, would have caused a sharp increase of the airborne fraction (the simple reason being that a rapid source increase provides less time for carbon to be moved downward out of the ocean’s upper layers). ……

…… We suggest that the surge of fossil fuel use, mainly coal, since 2000 is a basic cause of the large increase of carbon uptake by the combined terrestrial and ocean carbon sinks. One mechanism by which fossil fuel emissions increase carbon uptake is by fertilizing the biosphere via provision of nutrients essential for tissue building, especially nitrogen, which plays a critical role in controlling net primary productivity and is limited in many ecosystems (Gruber and Galloway 2008). Modeling (e.g., Thornton et al 2009) and field studies (Magnani et al 2007) confirm a major role of nitrogen deposition, working in concert with CO2 fertilization, in causing a large increase in net primary productivity of temperate and boreal forests. Sulfate aerosols from coal burning also might increase carbon uptake by increasing the proportion of diffuse insolation, as noted above for Pinatubo aerosols, even though the total solar radiation reaching the surface is reduced.

The paper concludes

The principal implication of our present analysis probably relates to the Faustian bargain. Increased short-term masking of greenhouse gas warming by fossil fuel particulate and nitrogen pollution represents a ‘doubling down’ of the Faustian bargain, an increase in the stakes. The more we allow the Faustian debt to build, the more unmanageable the eventual consequences will be. Yet globally there are plans to build more than 1000 coal-fired power plants (Yang and Cui 2012) and plans to develop some of the dirtiest oil sources on the planet (EIA 2011). These plans should be vigorously resisted. We are already in a deep hole—it is time to stop digging.

Climate sensitivities are not what they have been made out to be

March 27, 2013

A far from settled science! In fact – Climate Science may well be a discipline but it is a long, long way from being a science.

But the bottom line is that when “the observed trends are pushing down, whereas the models are pushing up” and “the mismatch between rising greenhouse-gas emissions and not-rising temperatures is among the biggest puzzles in climate science just now. it is time to stop fudging the models and to start examining the assumptions in the models again.

An important article and a “Must Read” even if I would take exception to their uncritical and naive acceptance of the effect of  carbon dioxide in the atmosphere.

The Economist:

OVER the past 15 years air temperatures at the Earth’s surface have been flat while greenhouse-gas emissions have continued to soar. The world added roughly 100 billion tonnes of carbon to the atmosphere between 2000 and 2010. That is about a quarter of all the CO₂ put there by humanity since 1750. And yet, as James Hansen, the head of NASA’s Goddard Institute for Space Studies, observes, “the five-year mean global temperature has been flat for a decade.”

Temperatures fluctuate over short periods, but this lack of new warming is a surprise. Ed Hawkins, of the University of Reading, in Britain, points out that surface temperatures since 2005 are already at the low end of the range of projections derived from 20 climate models (see chart 1). If they remain flat, they will fall outside the models’ range within a few years.

The mismatch between rising greenhouse-gas emissions and not-rising temperatures is among the biggest puzzles in climate science just now. It does not mean global warming is a delusion. Flat though they are, temperatures in the first decade of the 21st century remain almost 1°C above their level in the first decade of the 20th. But the puzzle does need explaining.

The mismatch might mean that—for some unexplained reason—there has been a temporary lag between more carbon dioxide and higher temperatures in 2000-10. Or it might be that the 1990s, when temperatures were rising fast, was the anomalous period. Or, as an increasing body of research is suggesting, it may be that the climate is responding to higher concentrations of carbon dioxide in ways that had not been properly understood before. This possibility, if true, could have profound significance both for climate science and for environmental and social policy. ……..

………… So what does all this amount to? The scientists are cautious about interpreting their findings. As Dr Knutti puts it, “the bottom line is that there are several lines of evidence, where the observed trends are pushing down, whereas the models are pushing up, so my personal view is that the overall assessment hasn’t changed much.”

Economist article

Prof. Peter A. Ziegler: Solar effects drive climate change not CO2

March 14, 2013
Peter Ziegler

Peter Ziegler: image The Geological Society

Prof. Peter Ziegler (b. 1928) is a Swiss geologist  and Titular Professor of Global Geology at the Geological-Paleontological Institute, University of Basel. He is a member of the Royal Netherlands Academy of Sciences, the Polish Academy of Arts and Sciences, the Russian Academy of Natural Sciences and the Academia Europaea. His presentation on the “Mechanisms of Climate Change” from February this year is pretty self-contained and self explanatory and my comments would only be superfluous.

Climate Change Ziegler 2013 (pdf)

I reproduce his conclusions slide below:

  • Climate change during industrial times can be fully explained by natural processes
  • During the last 550 Million years major natural climate changes involved large fluctuations in temperature and atmospheric CO2 concentrations
  • Apart from orbital forcing and the distribution of continents and oceans, variations in solar activity and the galactic cosmic ray flux controlled climate changes during the geological past and probably still do so
  • Despite rising atmospheric CO2 concentrations we may experience during the coming decades a serious temperature decline akin to the Maunder Minimum due to decreasing solar activity
  • There is overwhelming evidence that Temperature forces the Carbon Cycle and not vice-versa, as postulated by IPCC
  • IPCC underestimates the effects of direct and indirect solar climate forcing but overestimates CO2 forcing by assuming unrealistic positive temperature feedbacks from a concomitant water vapor and cloud increase
  • The IPCC consensus on anthropogenic CO2 emissions causing Global Warming cannot be reconciled with basic data and is therefore challenged

Global warming on hold (courtesy of the sun)

March 2, 2013
  • CO2 lags global temperature.
  • CO2 keeps increasing while temperature stands still.
  • Man made CO2 is about  3.6 % of all CO2 production

An inconvenient truth it’s the sun stupid!

16 years

CFACT Billboard

Carbon dioxide lags “global temperature” by 9 – 12 months

February 23, 2013

Just another case of an effect being taken as a cause and yet another nail in the coffin of the “CO2 causes global warming” fantasy.

A new paper in Global and Planetary Change Volume 100, January 2013, Pages 51–69

The phase relation between atmospheric carbon dioxide and global temperature 

by Ole HumlumKjell Stordahl and Jan-Erik Solheim

Highlights:

  1.  Changes in global atmospheric CO2 are lagging 11–12 months behind changes in global sea surface temperature. 
  2. Changes in global atmospheric CO2 are lagging 9.5–10 months behind changes in global air surface temperature.
  3. Changes in global atmospheric CO2 are lagging about 9 months behind changes in global lower troposphere temperature.
  4. Changes in ocean temperatures explain a substantial part of the observed changes in atmospheric CO2 since January 1980.
  5. Changes in atmospheric CO2 are not tracking changes in human emissions.
Figure 5 Humlum et al 2013

Fig. 5. 12-month change of global atmospheric CO2 concentration (NOAA; green), change in global surface air temperature (NCDC; blue), land surface air temperature (NCDC; yellow) and ocean surface air temperature (NCDC; red dotted). All graphs are showing monthly values of DIFF12, the difference between the average of the last 12 months and the average for the previous 12 months for each data series.

CO2 is bad, bad, bad……

February 12, 2013

Global warming morphs to climate change which morphs to extreme weather but CO2 is just plain bad!!!

CO2 is bad