Previous (2019): Abortion now a significant demographic parameter
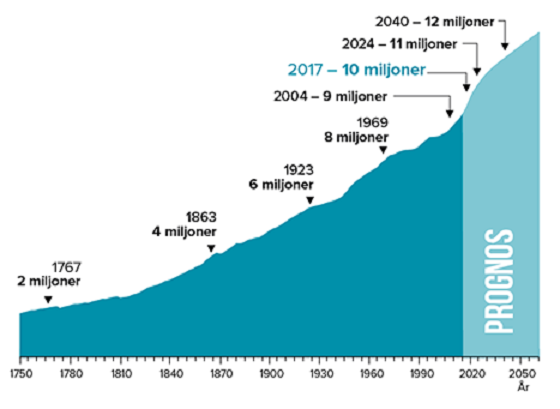
This update is not just a refresher – it has become much more urgent. The world has shifted from fearing too many people to fearing too few. What once was theoretical is now deeply real: population implosion is emerging not in distant projections, but in towns, schools, and economies collapsing due to fewer births.
Countries across the globe, from Greece to China, are deploying tax incentives, baby bonuses, and housing subsidies to shore up birth rates. Take China where cities like Hangzhou and Changsha now offer families 3,000–10,000 yuan annually per child, yet young people remain largely uninterested in having more kids (The Times of India). In Hungary, mothers with three or more children enjoy lifetime income tax exemptions, while even those with two or three benefit from deeply reduced housing loan rates (Wikipedia, Reddit). Still, experts caution these incentives seldom deliver lasting change (The Times, The Washington Post, Business Insider).
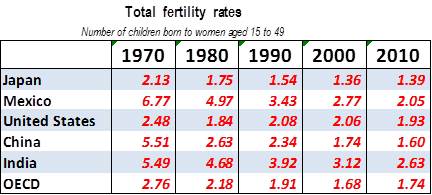
This trend is not just an outlier. In Greece, falling birth rates have forced the closure of over 750 schools (more than 5% of the total) rooted in a 19% drop in primary student numbers since 2018. Today, annual births sit below 80,000, while deaths continue to climb (Financial Times). Meanwhile, England and Wales have recorded record-low fertility rates (1.41 children per woman), and Scotland isn’t far behind at 1.25 and nowhere near the replacement rate of 2.1 (Financial Times).
In rural Japan, demographic erosion is already a visible reality. In Nanmoku, Gunma Prefecture, the population has collapsed from approximately 11,000 in 1955 to just 1,500 today. Now, 67.5% of residents are aged 65 or older, making it arguably Japan’s “grayest village” (Wikipedia, Kompas). More broadly, rural areas in Japan see abandoned farmland, empty homes, and aging populations. It is a national warning sign that the demographic collapse is not abstract but present (Kompas).
Immigration is often touted as the fix, but it’s a short-term patch. Studies show immigrant fertility tends to converge with the host nation’s average over just a few generations. In the UK, descendants, as quickly as the second generation start with elevated fertility but display significant variation depending on origin and assimilation dynamics (PMC, Demographic Research). In Sweden, similar patterns emerge: while birth timing may adapt, eventual completed fertility aligns closely with native norms (PubMed).
Against this backdrop, the demographic weight of abortion looks starkly more consequential than it did in 2019.
Then and Now: The Numbers
| Parameter (annual) | 2018–19 Estimates | 2025 Updated Estimates |
|---|---|---|
| Global births | ~140 million | ~134 million |
| Global deaths | ~60 million | ~67 million |
| Abortions | ~41 – 50 million | ~73 million |
| World population | ~7.7 billion | ~8.1 billion |
| Leading medical “cause of death” | Coronary disease (~10 million) | Still ~10 million |
| Abortions vs. leading cause | 4 – 5× higher | ~7× higher |
What Holds True
- Abortions still dwarf every medical cause of death in raw numbers, and are as impactful demographically as before.
- They continue to reduce births by roughly one-third, reinforcing their role as a key demographic parameter.
- Population stabilization and eventual decline remain on track, with or without abortion, but there is no doubt that abortion accelerates the timeline.
What Has Changed
- The sense of demographic crisis is now palpable, not just theoretical.
- Governments race for solutions, but incentives alone, no matter how generous, rarely reverse collapsing fertility (The Times, The Washington Post, The Times of India, Business Insider, Wikipedia).
- Visible examples of demographic collapse: Greece’s school closures, Japan’s vanishing villages.
- Immigration doesn’t restore declining birth rates indefinitely, thanks to fertility convergence across generations (PMC, Demographic Research, PubMed).
Conclusion
My 2019 thesis, that abortion is a significant demographic parameter, is still valid. If anything, it is more crucial today. With the world shifting from too many to too few, abortion stands as one of the clearest accelerants of demographic change and perhaps even of societal collapse. There are more fetuses terminated by abortions (73 million) than people die every year (67 million).