Murray Salby on carbon dioxide and temperature

June 11, 2013

Prof. Murray Salby’s presentation on 18th April 2013 in Hamburg explaining why carbon dioxide has little to do in causing global warming and in fact lags temperature both in the short term and in the long term.

 from NoTricksZone.

Models versus reality.

Indian monsoon on schedule

June 10, 2013

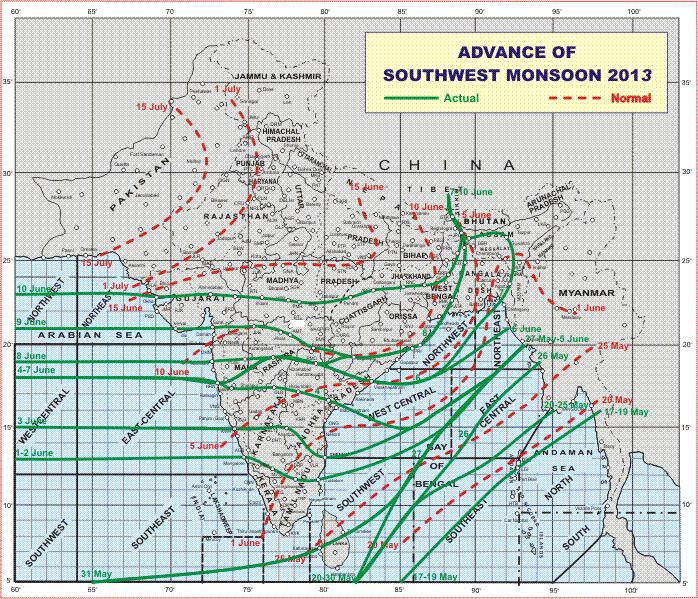
The Indian monsoon season has just started and officially runs from June to September. It seems to be on schedule and perhaps a little early in the west and a few days late in the east. Mumbai is seeing heavy rains a few days early.  Last year the monsoon was somewhat delayed and not too regular though it was “average” taken over the entire 4 months. With industrial growth still somewhat in the doldrums a boost to agricultural output will be very welcome.

( from IMD).

Monsoon progress 10th June 2013

Monsoon progress 10th June 2013

There are no signs of the catastrophe scenarios that climate models take delight in forecasting about the effects of global warming on the Indian monsoon.

Climate Models and Pepsodent

June 10, 2013

You’ll wonder where the warming went

when you brush your models with excrement

                                                                                                                                         with apologies to Pepsodent

Climate models just aren’t good enough – yet.

As real observations increasingly diverge from model results, the global warming establishment is reacting in 2 ways:

  1. Denial by the Warmist orthodoxy who prefer model results to real data , and
  2. Real scientists who have begun to questions the assumptions on which these models are based.

Two articles have recently been published in the mainstream scientific literature which question climate models.

1. What Are Climate Models Missing?, Bjorn Stevens and Sandrine Bony, Science, 31 May 2013, Vol. 340 no. 6136 pp. 1053-1054 , DOI: 10.1126/science.1237554

Abstract: Fifty years ago, Joseph Smagorinsky published a landmark paper (1) describing numerical experiments using the primitive equations (a set of fluid equations that describe global atmospheric flows). In so doing, he introduced what later became known as a General Circulation Model (GCM). GCMs have come to provide a compelling framework for coupling the atmospheric circulation to a great variety of processes. Although early GCMs could only consider a small subset of these processes, it was widely appreciated that a more comprehensive treatment was necessary to adequately represent the drivers of the circulation. But how comprehensive this treatment must be was unclear and, as Smagorinsky realized (2), could only be determined through numerical experimentation. These types of experiments have since shown that an adequate description of basic processes like cloud formation, moist convection, and mixing is what climate models miss most.

2. Emerging selection bias in large-scale climate change simulations, Kyle L. Swanson, Geophysical Research Letters, online 16th May 2013, DOI: 10.1002/grl.50562

Abstract: Climate change simulations are the output of enormously complicated models containing resolved and parameterized physical processes ranging in scale from microns to the size of the Earth itself. Given this complexity, the application of subjective criteria in model development is inevitable. Here we show one danger of the use of such criteria in the construction of these simulations, namely the apparent emergence of a selection bias between generations of these simulations. Earlier generation ensembles of model simulations are shown to possess sufficient diversity to capture recent observed shifts in both the mean surface air temperature as well as the frequency of extreme monthly mean temperature events due to climate warming. However, current generation ensembles of model simulations are statistically inconsistent with these observed shifts, despite a marked reduction in the spread among ensemble members that by itself suggests convergence towards some common solution. This convergence indicates the possibility of a selection bias based upon warming rate. It is hypothesized that this bias is driven by the desire to more accurately capture the observed recent acceleration of warming in the Arctic and corresponding decline in Arctic sea ice. However, this convergence is difficult to justify given the significant and widening discrepancy between the modeled and observed warming rates outside of the Arctic.


Pots and Kettles or Yeo-ing the Gummer

June 9, 2013

The Gummer has been Yeo-d. I have to conclude that Tim Yeo is the pot and Gummer is the kettle. Now if “Lord Deben”  – aka John Selwyn Gummer – fights back it could become a case of Gumming the Yeo.

Two articles today which need to be juxtaposed. This is perhaps mostly of domestic interest in the UK but I am always interested when Parliamentarians live down to my expectations. Of more general interest could be the manner in which “green” subsidies have been sucked out by the owners and developers of  wind and solar projects with the aid of venal politicians who have willingly helped to make the “rules”.

Was there ever a time when politicians died of shame?

Daily Mail: 

  • Tim Yeo has complained about Lord Deben’s undisclosed green interests
  • Mr Yeo has been paid more than £400,000 by three green companies
  • Lord Deben is chairman of firm which connects windfarms to National Grid

Tim Yeo, chairman of the Energy and Climate Change select committee, has protested about Lord Deben remaining chairman of Veolia Water UK while also chairing the Committee on Climate Change, an independent body that advises the Government on the impact of climate change.

Mr Yeo’s critics will argue his protest smacks of hypocrisy as he has been paid more than £400,000 by three green companies since 2009.

Lord Deben, John Selwyn Gummer – who as Agriculture Minister in 1990 tried to persuade his daughter Cordelia to eat a hamburger during the BSE crisis – was required to undergo a ‘confirmation hearing’ before Yeo’s committee last September after being appointed chair of the Climate Change Committee. ….. 

and

The Telegraph: 

Tim Yeo, the chairman of the Commons Energy and Climate Change Committee, also said he had coached John Smith, managing director of GB Railfreight, before the executive gave evidence to the committee last month. Yeo is a paid director and shareholder of Eurotunnel — the firm’s parent company.

Mr Yeo was filmed by undercover reporters working for The Sunday Times saying: “I told him [Mr Smith] in advance what to say. Ha-ha.”

When asked if he would be interested in a £7,000-a-day consultancy contract with a solar company, the MP said: “If you want to meet the right people, I can facilitate all those introductions and I use the knowledge I get from what is quite an active network of connections.”

The reporters queried if this included Government figures. Mr Yeo replied “Yes”.

The House of Commons’ code of conduct forbids MPs from acting as paid advocates, including by lobbying ministers. ….. 

The youth of the world in 2100

June 8, 2013

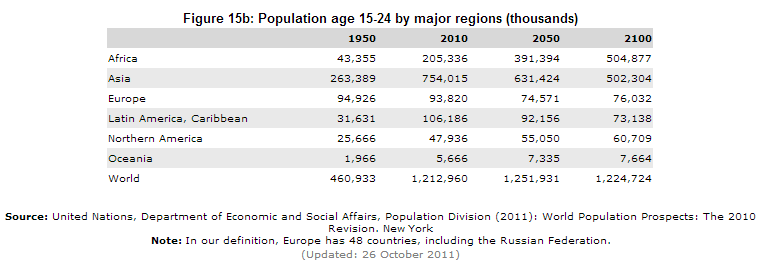
In China the youth (age 15 – 24) population is already declining. In India it will keep increasing till about 2050 and then decline. In Africa it will be growing until about 2100. Most of the youth of today will not be around in 2100 but the youth of that time who will see the world through to 2200 will be 500 million each in Africa and Asia and less than 300 million in the rest of the world – subject of course to any geographical population shifts that might take place. In the period till 2100 such migrations will probably not be so significant.

From the UN’s World Population Prospects (2012 Revision):

Population age 15-24

youth of the world 2100

The reality of “climate change” for a gardener

June 8, 2013

Reality has this nasty habit of rudely intruding upon climate models – and the pronouncements of august bodies like the IPCC.

Reblogged from Bishop Hill:

A reader kindly points me to the blog of UK seed merchant Thompson and Morgan, where Emma Cooper is wondering what to plant this year:

Over the years in which climate change has been discussed in the media, there have been continual suggestions that it will be of benefit to gardeners – allowing us to grow fruit and vegetable crops that enjoy the continental climate, but fail to thrive in a traditional British summer. As those warm summer days have failed to materialise, and look increasing unlikely, I am eyeing up my new allotment with a view to planting crops that will enjoy our cool climate. ……

But 97% of the world’s “climate scientists” can’t be wrong – can they?

And yet another idiot study – this time about Facebook damaging relationships

June 8, 2013

The use of Facebook is spawning a great deal of idiot research.

Facebook is providing a fertile hunting ground for simplistic “research” by a new breed of “researchers”. Social psychology is still just a discipline and has yet to reach the level of a “science”. But I note that surveys of Facebook users is multiplying and seems to have  become a new field of social psychology. The surveys are easily done, usually include a sample size of just a few hundred (small enough to access on a University campus or in a town square) and draw fanciful conclusions to capture the headlines. They provide an easy way to publication. Such “Facebook research” is not “bad science” – if even “science” at all – but much of it is trivial and just provides a quick, cheap way of getting published.

And here comes another idiot “survey” described in this press release (a press release for this?) from the University of Missouri:

good grief

Excessive Facebook Use Can Damage Relationships, MU Study Finds

Facebook and other social networking web sites have revolutionized the way people create and maintain relationships. However, new research shows that Facebook use could actually be damaging to users’ romantic relationships. Russell Clayton, a doctoral student in the University of Missouri School of Journalism, found that individuals who use Facebook excessively are far more likely to experience Facebook–related conflict with their romantic partners, which then may cause negative relationship outcomes including emotional and physical cheating, breakup and divorce.

In their study, Clayton, along with Alexander Nagurney, an instructor at the University of Hawaii at Hilo, and Jessica R. Smith, a doctoral student at St. Mary’s University in San Antonio, surveyed Facebook users ages 18 to 82 years old. Participants were asked to describe how often they used Facebook and how much, if any, conflict arose between their current or former partners as a result of Facebook use. The researchers found that high levels of Facebook use among couples significantly predicted Facebook-related conflict, which then significantly predicted negative relationship outcomes such as cheating, breakup, and divorce. ..

 …… “Although Facebook is a great way to learn about someone, excessive Facebook use may be damaging to newer romantic relationships,” Clayton said. “Cutting back to moderate, healthy levels of Facebook usage could help reduce conflict, particularly for newer couples who are still learning about each other.”

This study is forthcoming in the Journal of Cyberpsychology, Behavior and Social Networking.

“Good Grief”!

Peer reviewed no doubt.

The insight this provides into relationships and behaviour is not less than profound.

(I must be feeling a little crabby this morning – I need to cut the grass!).

When this interglacial ends ….

June 7, 2013

This interglacial will end.

It may take another 100 years or 5,000 or it may already have ended. From whenever the end is reckoned  it could take about 4,000 years for full glacial conditions to set in.

interglacials

This interglacial will end

The ice sheets will advance again. New land will be exposed as sea levels fall – up to 120m.

The land mass of the world with the reduced sea levels might look like this (http://www.ngdc.noaa.gov/mgg/topo/globega2.html:

world map ice age image National Geophysical Data Center at NOAA

world map ice age image National Geophysical Data Center at NOAA

Geography will change. Islands will expand. Some seas will disappear as water gets locked up in the expanding ice sheets.  Greenland will expand. Siberia will connect to North America again. The United Kingdom will once again rejoin the continent. Indonesia and Australia will be extremely close. Japan will no longer be islands. The Baltic Sea will not exist. The Persian Gulf will disappear. Across the world coastlines will be “pushed out”. Ancient coastal city sites – long submerged – will reappear. The ice sheets will expand and will drastically reduce populations above 55 °N. The global population would have stabilised and may even fall. Populations will migrate. Nation states will  see their boundaries changing – physically not just by war. No doubt there will be new human conflicts as populations shift – though the shifts will be over hundreds of years and quite gradual in our terms. Average global temperatures will be about 2 – 4°C colder than today.

But this time the ice sheets will not stop humans from utilising the resources under some of the ice sheets. As during the last glacial period, human innovation and engineering will flourish and reach new heights as the challenges are met. New science and new technologies will appear. Art will take new forms. A new wave of exploration will occur – this time into space. And through all of this our energy needs will increase.

Time line of prehistoric inventions (pdf)

But it is the availability of abundant energy which will be the deciding factor, which allows growth to continue and which allows the continued  improvement of the human condition. And this energy will primarily be fossil energy and nuclear energy.  It will be nuclear energy for large central plants (> 1000 MW), fossil energy (coal, and gas) for medium sized plants (100 – 1000 MW)  and gas for municipal and domestic applications. Transportation will – largely as now – be electric or oil-based though the proportion of electric (charged from “cheap” nuclear power) vehicles will increase. Solar and wind and wave and tidal power will have their little place but will – as now – be of small impact.

It is fossil and nuclear power which will allow humanity to meet these new challenges. They will be a necessity for humans to flourish. Carbon dioxide emissions – as now – will be irrelevant. It is in the development of small nuclear, energy storage and more efficient gas- winning and utilisation that we should be concentrating.

Walking Eagles and carbon taxes

June 6, 2013

This is a couple of years old though I only just came across it.

Seems very apt – not only for carbon taxes but also for Tony Blair.

Tony 'Walking Eagle' Blair

Tony ‘Walking Eagle’ Blair

Osho News:

On a recent trip to the United States, Tony Blair, Ex. Prime Minister of the UK, addressed a major gathering of Native American Indians.

He spoke for almost an hour on his plans for a Carbon Trading Tax for the UK and Europe

At the conclusion of his speech, the crowd presented him with a plaque inscribed with his new Indian name – Walking Eagle.

A very proud Tony then departed in his motorcade, waving to the crowds.

A news reporter later asked one of the Indians how they came to select the new name given to Tony Blair.

They explained that Walking Eagle is the name given to a bird so full of sh1t that it can no longer fly.

Climate models stretch credulity

June 6, 2013

What is perplexing is the blind faith in the climate models and reluctance to revisit the assumptions on which the clearly fallacious models are based.

UPDATE!!

Dr. Spencer has also provided the “un-linearised” data  and writes:

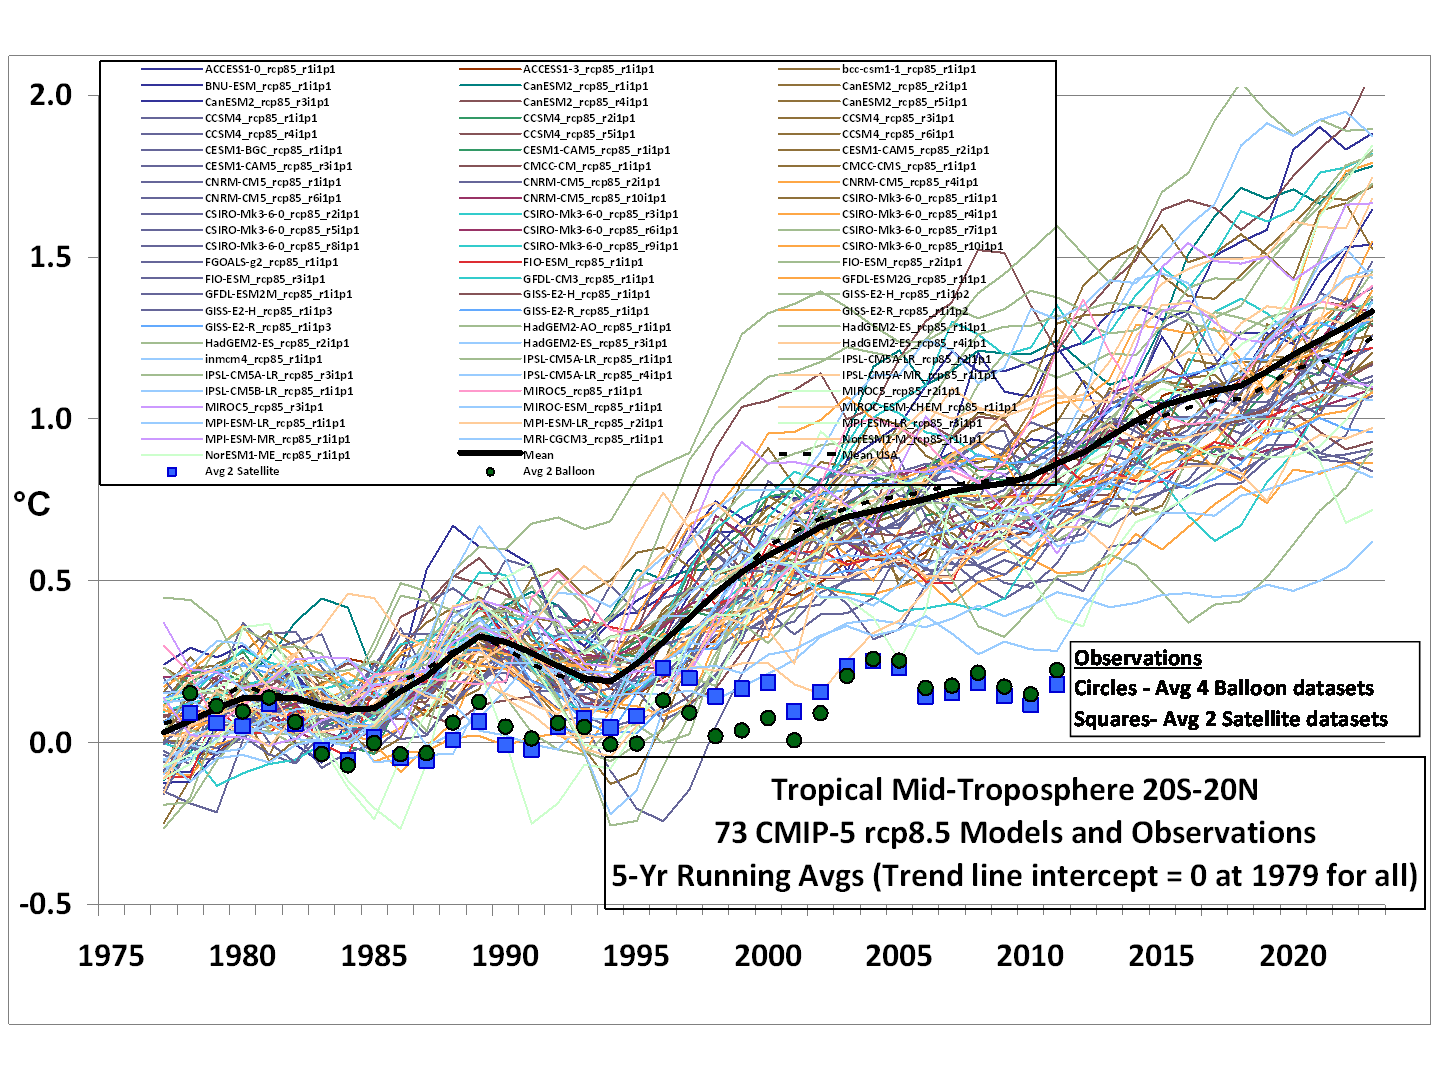
In response to those who complained in my recent post that linear trends are not a good way to compare the models to observations (even though the modelers have claimed that it’s the long-term behavior of the models we should focus on, not individual years), here are running 5-year averages for the tropical tropospheric temperature, models versus observations (click for full size):
CMIP5-73-models-vs-obs-20N-20S-MT-5-yr-means
In this case, the models and observations have been plotted so that their respective 1979-2012 trend lines all intersect in 1979, which we believe is the most meaningful way to simultaneously plot the models’ results for comparison to the observations.

In my opinion, the day of reckoning has arrived. The modellers and the IPCC have willingly ignored the evidence for low climate sensitivity for many years, despite the fact that some of us have shown that simply confusing cause and effect when examining cloud and temperature variations can totally mislead you on cloud feedbacks (e.g. Spencer & Braswell, 2010). The discrepancy between models and observations is not a new issue…just one that is becoming more glaring over time. ….

….

Reblogged from Dr. Roy Spencer

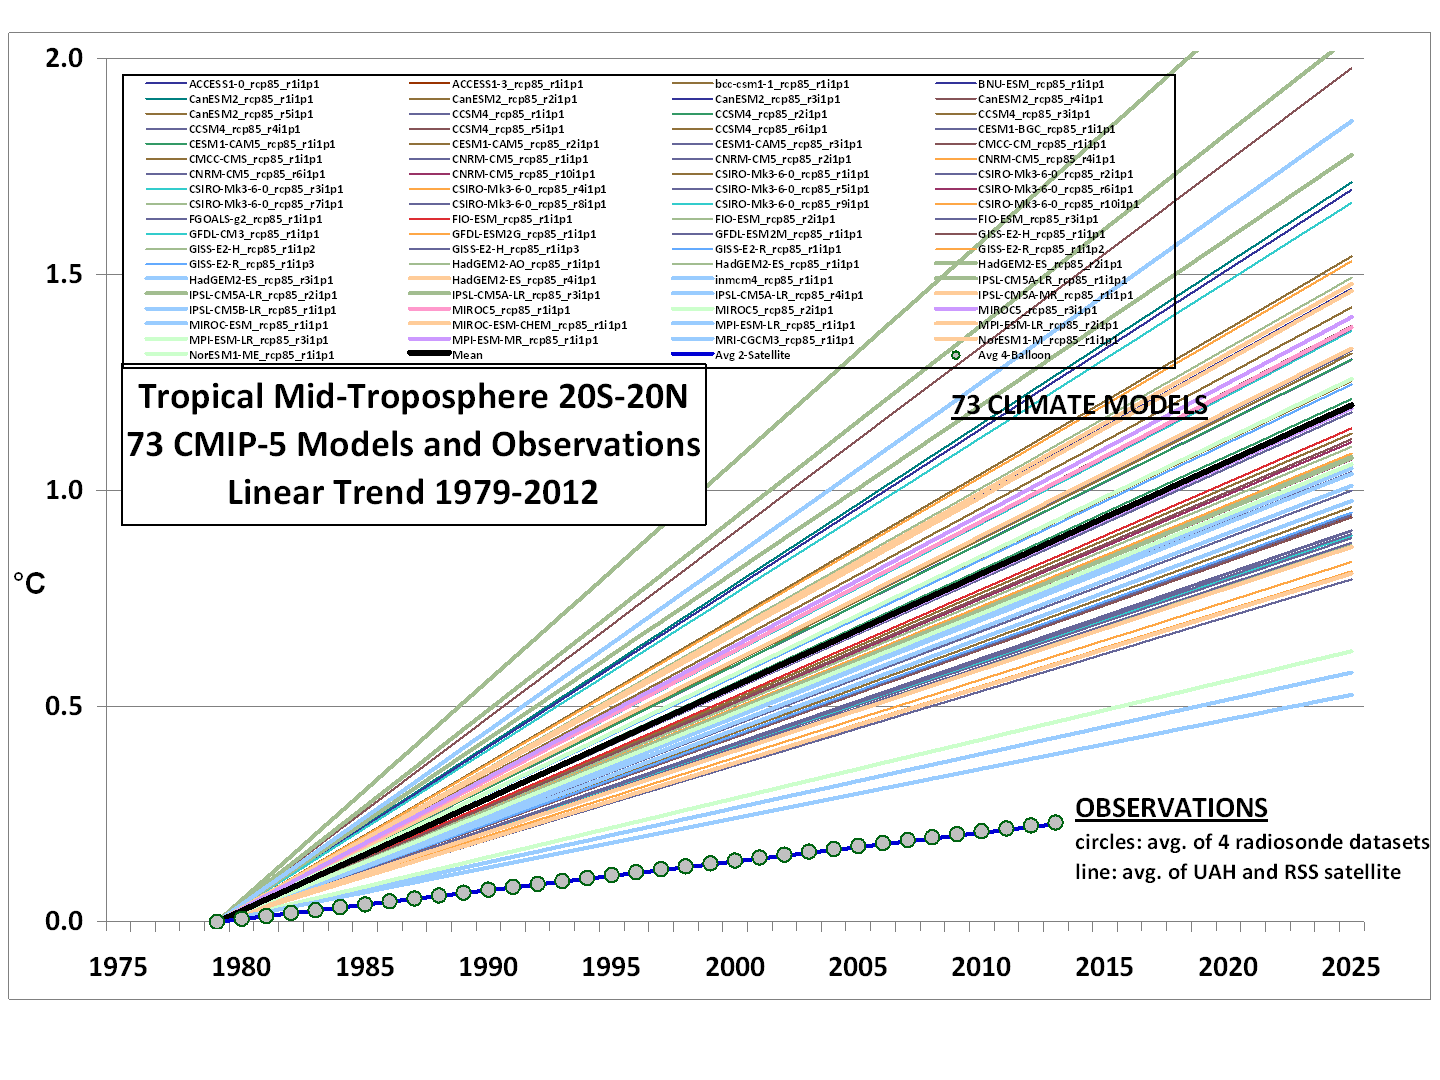
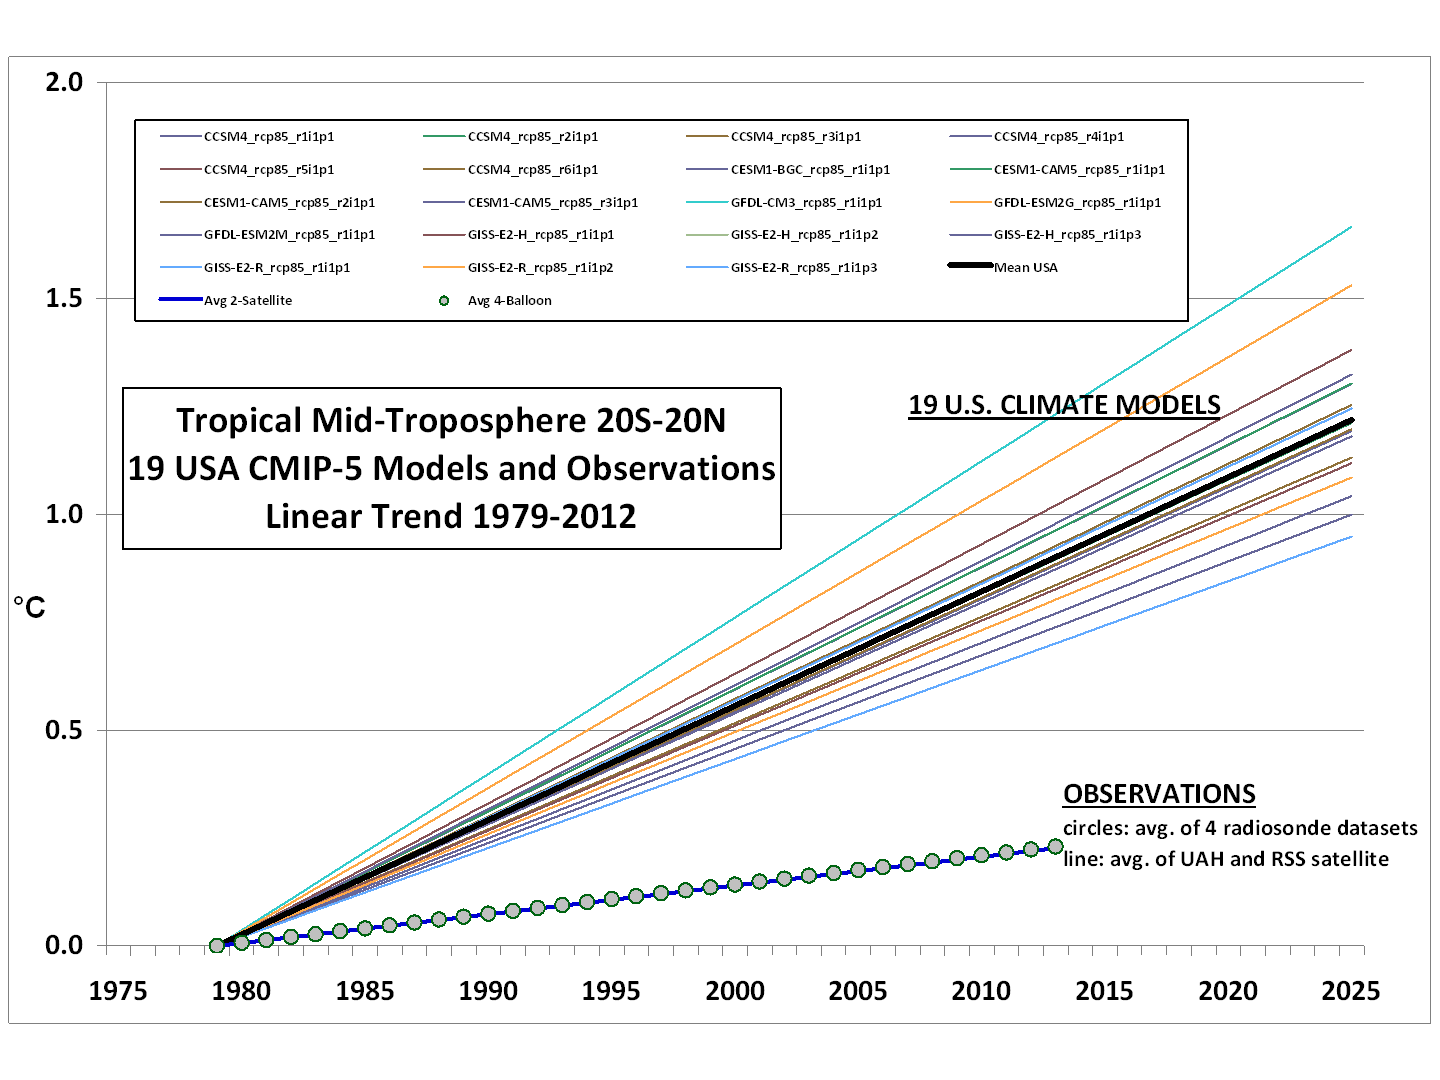
Courtesy of John Christy, a comparison between 73 CMIP5 models (archived at the KNMI Climate Explorer website) and observations for the tropical bulk tropospheric temperature (aka “MT”) since 1979 (click for large version):
CMIP5-73-models-vs-obs-20N-20S-MT
Rather than a spaghetti plot of the models’ individual years, we just plotted the linear temperature trend from each model and the observations for the period 1979-2012.

Note that the observations (which coincidentally give virtually identical trends) come from two very different observational systems: 4 radiosonde datasets, and 2 satellite datasets (UAH and RSS).

If we restrict the comparison to the 19 models produced by only U.S. research centers, the models are more tightly clustered:
CMIP5-19-USA-models-vs-obs-20N-20S-MT

Now, in what universe do the above results not represent an epic failure for the models?

I continue to suspect that the main source of disagreement is that the models’ positive feedbacks are too strong…and possibly of even the wrong sign.

The lack of a tropical upper tropospheric hotspot in the observations is the main reason for the disconnect in the above plots, and as I have been pointing out this is probably rooted in differences in water vapor feedback. The models exhibit strongly positive water vapor feedback, which ends up causing a strong upper tropospheric warming response (the “hot spot”), while the observation’s lack of a hot spot would be consistent with little water vapor feedback.