Posts Tagged ‘climate change’

A new, profound insight into “climate change cooperation”

October 21, 2013

There is bad science and there is silly science and there is trivial science. There is also inane science.

And their are learned journals for all of them. This is a new paper published by Nature Climate Change. (One wonders why?). The authors though can be very pleased since they can each add another paper to their respective list of publications. “We learned from this experiment that even groups gravitate towards instant gratification” 

Wow!

Jennifer Jacquet, Kristin Hagel, Christoph Hauert, Jochem Marotzke, Torsten Röhl, Manfred Milinski. Intra- and intergenerational discounting in the climate gameNature Climate Change, 2013; DOI: 10.1038/nclimate2024

EurekAlert has this to say:

Delayed gratification hurts climate change cooperation

Time is a huge impediment when it comes to working together to halt the effects of climate change, new research suggests.

A study published today in the journal Nature Climate Change reveals that groups cooperate less for climate change mitigation when the rewards of cooperation lay in the future, especially if they stretch into future generations.

“People are often self-interested, so when it comes to investing in a cooperative dilemma like climate change, rewards that benefit our offspring – or even our future self – may not motivate us to act,” says Jennifer Jacquet, a clinical assistant professor at New York University’s Environmental Studies Program, who conducted the research while a postdoctoral fellow working with Math Prof. Christoph Hauert at the University of British Columbia.

“Since no one person can affect climate change alone, we designed the first experiment to gauge whether group dynamics would encourage people to cooperate towards a better future.”

Researchers at UBC and two Max Planck Institutes in Germany gave study participants 40 Euros each to invest, as a group of six, towards climate change actions. If participants cooperated to pool together 120 Euros for climate change, returns on their investment, in the form of 45 additional Euros each, were promised one day later, seven weeks later, or were invested in planting oak trees, and thus would lead to climate benefits several decades down the road – but not personally to the participants. Although many individuals invested initially in the long-term investment designed to simulate benefits to future generations, none of the groups achieved the target.

“We learned from this experiment that even groups gravitate towards instant gratification,” says Hauert, an expert in game theory, the study of strategic decision-making.

The authors suggest that international negotiations to mitigate climate change are unlikely to succeed if individual countries’ short-term gains are not taken into consideration.

Could there be any form of cooperation – in any field – where long-term gains are not out-weighed by instant gratification? For any investment – let alone a cooperative investment – given a choice of a short payback or a long payback, is there any case where the long payback period is chosen? 

This is so profound and so deep an insight it almost hurts!

The IPCC 95% trick: Increase the uncertainty to increase the certainty

October 17, 2013

Increasing the uncertainty in a statement to make the statement more certain to be applicable is an old trick of rhetoric. Every politician knows how to use that in a speech. It is a schoolboy’s natural defense when being hauled up for some wrongdoing. It is especially useful when caught in a lie. It is the technique beloved of defense lawyers in TV dramas. Salesmen are experts at this. It is standard practice in scientific publications when experimental data does not fit the original hypothesis.

Modify the original statement (the lie) to be less certain in the lie, so as to be more certain that the statement could be true. Widen the original hypothesis to encompass the actual data. Increase the spread of the deviating model results to be able to include the real data within the error envelope.

  • “I didn’t say he did it. I said somebody like him could have done it”
  • “Did you start the fight?” >>> “He hit me back first”.
  • “The data do not match your hypothesis” >>> “The data are not inconsistent with the improved hypothesis”
  • “Your market share has reduced” >>> “On the contrary, our market share of those we sell to has increased!” (Note -this is an old one used by salesmen to con “green” managers with reports of a 100% market share!!)

And it is a trick that is not foreign to the IPCC  – “we have a 95% certainty that the less reliable (= improved) models are correct”. Or in the case of the Cook consensus “97% of everybody believes that climate does change”.

A more rigorous treatment of the IPCC trick is carried out by Climate Audit and Roy Spencer among others but this is my simplified explanation for schoolboys and Modern Environ-mentalists.

The IPCC Trick

The IPCC Trick

The real comparison between climate models and global temperatures is below:

Climate Models and Reality

Climate Models and Reality

With the error in climate models increased to infinity, the IPCC could even reach 100% certainty. As it is the IPCC is 95% certain that it is warming – or not!

IPCC = International Promotion of Global Warming

September 28, 2013

It is quite wrong to think of the IPCC as some august body looking objectively at Climate Change and what causes climate to change. They only operate as a PR agent – under the cloak of consensus science – for the Global warming hypothesis. Global cooling hypotheses or – in fact – any hypotheses other than carbon dioxide being the controller of global temperature are given short shrift. Even real observations and all global cooling trends are ignored. Global warming models take precedence over real data. The Sun is ignored. Climate sensitivities is apparently too new a topic to be considered.

They do not just cherry pick data; they just ignore it when they represent inconvenient truths. The last 17 years with no global warming are merely dismissed as being for too short a period. But then the IPCC has only been in operation for 25 years. The IPCC has not looked up from its computer models to realise that for most of its life it has seen no global warming.

If the IPCC was really looking at climate change and not just promoting the idea of global warming they might have shown some interest in the climate trend-break which seems to have occurred about 15 years ago. But a trend-break would be heretical. Their dismissal yesterday of the last 15 – 18 years was disgraceful. How, after such real observations, they are more certain than ever that global warming continues and that carbon dioxide is the culprit, is not rational and can only be “wishful thinking” (to put the best interpretation on it).

(data below generated using woodfortrees interactive database)

Global temperatures since 1850

Global temperatures since 1850

And how their certainty about carbon dioxide being the prime culprit can be increased with the reality of temperatures declining in the last 15 or so years  boggles rationality. Except of course that their certainty is based on climate models and cannot be bothered by real observations.

CO2 and global temperatures 1998-2013

CO2 and global temperatures 1998-2013

IPCC still cooking it’s books to cover-up the inconvenient truths

September 27, 2013

The 95% probability/certainty of global warming being due to human activity is based on a show of hands and not on any evidence or statistical analysis of data. What it actually says is that 95% of all global warming believers, believe.

Late last night the IPCC delegates in Stockholm were still messing around preparing their 30 page political summary of their AR5 report to be released today.

The political summary of AR5 is primarily a CYA effort to protect the posteriors of the policy makers (mainly political figures, bureaucrats and activists) in the face of a long row of broken models and broken hypotheses. The IPCC has forgotten that natural variability is a euphemism for unknown mechanisms which cannot be calculated or predicted. It is going to be interesting to see just how the summary report will cover-up, deny or ignore the long string of inconvenient facts:

  • Global temperatures have not risen for 17-18 years while CO2 has kept on increasing. 
  • Global temperatures have been declining for the last 11 years. 
  • None of the IPCC’s computer models have predicted the warming hiatus or the cooling over the last decade.
  • Global wildfires are lower than normal. 
  • Rainfall patterns (and the Indian monsoon) continue within the bounds of known natural variability. 
  • Food and grain production is at an all-time high. 
  • Flood frequency and flood levels have not been at unprecedented levels. Just more people live in flood-plains today than before. 
  • CO2 in the atmosphere reached the magic level of 400 ppm (albeit for just a few hours) and nothing happened.
  • How much of the CO2 concentration increase is due to carbon dioxide from fossil fuel. combustion is unclear but fossil fuel emissions are only 5% of global carbon dioxide emissions. 
  • The absorption and release of carbon dioxide by the oceans is unknown and the error margin is greater than the total amount released by fossil fuels.
  • CO2 absorption mechanisms do not care where the CO2 being absorbed came from.
  • The sensitivity of global temperature to CO2 concentration has been grossly exaggerated by the computer models.
  • Carbon dioxide concentration is more likely to follow global temperature (due to subsequent changes in emission and absorption rates) than to lead it.
  • Sea ice levels are increasing at both poles with the Antarctic at record high levels.
  • Polar bear populations are thriving and increasing.
  • Sea levels are continuing to rise at just the historical levels due to the recovery from the last glacial and are not accelerating due to industrialisation or the use of fossil fuels.
  • Oceans are still strongly alkaline and any increase in acidity is within known natural variability.
  • Coral reefs have shown themselves to be self-healing when damaged and are not showing any signs of ocean acidification.
  • Climate models have grossly underestimated solar effects because the mechanisms are unknown.
  • Sunspot activity in SC24 is well down from SC 23 and is not unlike the period of the dalton minimum during SC5 and SC6.
  • Clouds and moisture in the atmosphere have a much bigger impact on global warming and cooling than CO2 in the atmosphere.
  • Cloud formation is linked to sunspot activity and cosmic rays.
  • Global warming and cooling follow solar effects via the oceans in long decadal cycles.
  • The number of hurricanes and tornadoes are at historically low levels.
  • Heat released from the earth’s interior by tectonic and volcanic activity is not known.
  • A Little Ice Age is more likely than further Global Warming and a global cooling cycle lasting 20-30 years may have begun.
  • This interglacial is due (within c. 1000 years) to come to an end.

There is more we don’t know that we don’t know about the climate than the IPCC would like to admit. And for policy makers, activists and bureaucrats who have followed misguided policies for the last 25 years it is no longer possible to admit that they have been making “certain” predictions in an ocean of uncertainty. They have replaced scientific objectivity by “consensus science” where the validity of a hypothesis is based on how many believe and not on evidence. The 95% probability/certainty of global warming being due to human activity being touted by the IPCC is based on a show of hands of believers, and not on any evidence or statistical analysis of data.

Simple truths are becoming highly inconvenient for the IPCC

September 21, 2013

The simple truths are

  1. Global temperatures exhibit no warming for the last 17-18 years, and
  2. Carbon dioxide concentrations in the atmosphere have increased continuously during the same period  noting that man made carbon dioxide emissions constitute about (at most) 5% of all carbon dioxide emissions.

The tag of “Denier” is now shifting to the Global Warmists who are denying that there is a hiatus in “global warming”. And to those who deny that the causal link between carbon dioxide concentration and global warming – which itself is highly speculative – is now clearly broken.

The Global Warming brigade are now putting pressure on the IPCC and “learned” journals to conceal, cover up, explain away and generally deny these two simple truths for the upcoming release (in parts) of the AR5 report. It is a full-court denialist press to try and ensure that AR5 is not treated as scrap even before it is released.

The reality of global temperatures is increasingly diverging from increasingly discredited climate models. In fact the reality of global temperature measurements since about 1978 would not provide any convincing evidence that any concern regarding “global warming” was justified.

Climate Models versus Reality

Not only are temperatures not increasing as the models  – and their religious adherents – would like but atmospheric concentrations of carbon dioxide have continued to increase unabated.

Global temparature and carbon dioxide – last 17 years

The two simple truths lead to two simple – but inescapable – conclusions

  1. There is no evidence that “global warming” is an irreversible phenomenon. There is no evidence either that global warming or global cooling are anything other than “natural” variations of climate.
  2. Carbon dioxide concentration in the atmosphere is not strongly indicated – if at all – as anything but a very small component of the very many which affect global temperature. The man made contribution to global carbon dioxide emissions itself  is about 5% of all carbon dioxide emissions.

The irony of global warmists now becoming the “hiatus deniers”

September 1, 2013

Denying the hiatus without being seen to deny it is now becoming the most important task facing the IPCC global warmists, That the “missing heat” cannot be found is a “travesty”! It could be hiding in the deep oceans or maybe it is in the deep mantle. It can’t be in the upper atmosphere because there we have measurements.

Perhaps it is just not there but that would be too simple!

The high priests of global warming are all joining the cult of the “hiatus deniers”.

Reblogged from P. Gosselin at NoTricksZone:

Die Welt Veteran Journalist: “Ignoring Warming Stop Would Be Ridiculous”, Missing Heat “Perhaps Just Doesn’t Exist”

Veteran journalist Ulli Kulke at German national daily Die Welt has a commentary at his Die Welt blog about the upcoming IPCC report. IPCC: Discuss or Ignore Warming Stop. He starts:

According to News Service Bloomberg it is currently being discussed whether to mention the ongoing 15-year pause in global in the 5th Assessment Report“ (AR 5) to be released in late September, or if perhaps it would be better to simply ignore it in order not to unnecessarily supply so-called ‘climate skeptics’ with ammunition.”

Alarmist scientists find themselves in a dilemma and aren’t sure what to do. They are eager to argue back against skeptics’s claims that the warming has stopped, yet are petrified of bringing it up. Some are saying it is simply best to ignore the pause in warming. But Kulke writes:

The attempt to keep the warming pause out of the ongoing discussion surrounding the upcoming AR 5 would be ridiculous. Semantic and formal splitting of hairs would not stick because it cannot be denied that also the In-group of the IPCC scientists have acknowledged the stop in warming – at least internally – and view this as the biggest problem. It is “a travesty” they cannot explain. That quote comes from Kevin Trenberth, a lead author of the 2001 and 2007 IPCC reports. […] In the meantime Trenberth suspects, according to his models, that the missing heat is somewhere in the depths of the oceans. But this is not certain in any way; perhaps it just doesn’t exist.”

Kulke then adds that the IPCC also will not be able to downgrade the warming pause to a mere weather event and claim that it has nothing to do with overall climate:

Just because it is still in the range of weather and has not yet reached the time span that one uses to discuss climate, ignoring the warming stop would also be outrageous because it would mean you couldn’t mention any weather event that is not at least 30 years long.”

If increasing frequency is the test that alarmists like to use, then it’s tough to get more frequent than every year over the last 15. You can’t claim a team is in a slump-trend after it has just won 15 games in a row.

For the alarmist IPCC scientists, it’s a damned-if-you-do, damned-if-you-don’t situation. Bringing up the warming stop surely will be ammo for the skeptics, but so would ignoring it. Should we feel sorry for them? I don’t think so. It was they themselves who maneuvered their own jewels between the jaws of the vise. Last chance to pull them out!

Nature Editorial – All change but no change (because the heat is hidden)

August 29, 2013

A very peculiar Nature Editorial.

First they confirm that there has been a hiatus in global temperature.Then they report on recent papers trying to invoke ocean cycles and their impact on global temperatures. This is followed by a claim that this does not explain the “missing heat” but fail to say that there may be no “missing heat” at all if global warming has slowed-down or ceased. By assuming that there must be “missing heat” they then claim that the underlying science has not changed. The key point of course is that if ocean cycles can cause global cooling they can also cause global warming. Natural processes can then well explain all the temperature observations of the last 150 years. Carbon dioxide concentration in the atmosphere and the 5% of global emission that is man-made emissions of carbon dioxide become irrelevant and unnecessary to the explanations for changes to climate.

“Hidden heat” that cannot be found is just a convenient excuse to avoid having to scrap most of the existing climate models. And what Nature fails to mention is that if there is no “missing heat” then the entire edifice that is the man-made global warming hypothesis comes crashing down.

Nature: Hidden heat

Nature 500, 501 (29 August 2013), doi:10.1038/500501a

This week, Nature publishes a study online suggesting that a recent cooling trend in the tropical Pacific Ocean can explain the current hiatus in global warming. Authored by a pair of scientists at the Scripps Institution of Oceanography in La Jolla, California, the paper does not say why the Pacific seems to have entered a prolonged ‘La Niña’ phase, in which cooler surface waters gather in the eastern equatorial Pacific. It is also silent on where the missing heat is going. But it does suggest that this phenomenon — affecting as little as 8% of Earth’s surface — could temporarily counteract the temperature increase expected from rising greenhouse-gas emissions

(Y. Kosaka and S.-P. Xie  Nature, http://dx.doi.org/10.1038/nature12534; 2013).

Previous modelling studies have linked the pause to La-Niña-like conditions that have prevailed since 1999, suggesting that heat that would otherwise go into the atmosphere is getting buried deeper in the ocean. And scientists at the National Center for Atmospheric Research in Boulder, Colorado, have a study in the press indicating that decades in which global air temperature rises rapidly — including the 1980s and 1990s — are associated with warmer temperatures in the tropical Pacific, as exemplified by La Niña’s opposite effect, El Niño (G. A. Meehl et al. J. Climate http://doi.org/nkw; 2013). The Scripps researchers also confirmed that El-Niño-like conditions can boost global temperatures.

Scientists seem to be homing in on an important lever in the climate system. And none too soon. Although a prolonged hiatus in warming does not necessarily contradict prevailing theory, this one came as a surprise and has been used to discredit the climate-science community. The story will probably not end there. Scientists know that the Sun has been in a prolonged solar minimum for several years, which means less incoming energy, and there may yet be a role for sunlight-blocking aerosols — human pollution and volcanic ash — and other factors in the hiatus. But at least a better explanation of the climate system is beginning to take shape.

All of this comes as the Intergovernmental Panel on Climate Change (IPCC) prepares to release the first instalment of its fifth assessment report. The hiatus in warming is at the centre of an ongoing debate about ‘equilibrium climate sensitivity’, which is the amount of warming that would be expected over the long term owing to a doubling of atmospheric carbon dioxide levels. Several papers have assessed the most recent data and conclude that the climate may not be as sensitive to greenhouse gases as was previously thought. The latest draft of the IPCC summary for policy-makers accounts for this — just. It suggests a likely climate sensitivity of 1.5–4.5 °C, compared with a range of 2–4.5 °C in the IPCC’s last assessment report.

Some argue that recent temperature trends show that the climate problem is less urgent. One can only hope that this is so, and scientists will continue to probe the matter. But policy-makers would be foolhardy to think that the danger has receded. Although scientists understand the basic physics, nobody can know how the numbers will turn out, as shown by the various temperature projections. Plenty of other lines of evidence, including palaeoclimate data and modern modelling experiments, support the higher end of these.

Ultimately, the decision over how to characterize climate sensitivity will fall to government officials who will approve — under the watchful eye of scientists — the latest IPCC documents in Stockholm next month. Whatever their decision, the underlying science has not changed.

This 2007 ClimateGate quote seems timely:

“What if climate change appears to be just mainly a multidecadal natural fluctuation? They’ll kill us probably…”

[Via Barry Woods; Tommy Wills, Swansea University to the mailing list for tree-ring data forum ITRDB, 28 Mar 2007]

Global warming hiatus confirmed – now the Pacific is to “blame”

August 28, 2013

Speculation is rife as to why there has been no global warming for the last 17 or 18 years. Some of this speculation is by those who believe the science is settled and is merely to try and “save” the discredited climate models used by the IPCC. Others – the real scientists – actually use it as an opportunity to investigate something that is not very well understood at all.

The lack of warming has been “blamed” on a variety of reasons. Some have blamed mysterious heat storage in the deep ocean where the heat has actually been transported from and through colder temperatures to higher temperatures! Others say that aerosols and soot in the atmosphere – due to pollution – have distorted the warming trend by hiding the sun. Some few point out that the models really don’t know how to treat clouds and moisture in the atmosphere and what actually drives cloud formation is still an unknown unknown. And there are those – like me – who put it down to natural variation which in turn is ultimately driven – via many still unknown mechanisms – by the Sun.

The El Nino-Southern Oscillation, has a major impact on global climate and is usually acknowledged but a new paper in Nature now suggests that the lack of warming is due to the Pacific Decadal Oscillation that lasts for a much longer period of time (15 – 30 years).  There may well be some influence of the Pacific Decadal Oscillation and no doubt it should be investigated further. But it does first need an acknowledgement that there is something to be investigated. As the authors begin “Despite the continued increase in atmospheric greenhouse gas concentrations, the annual-mean global temperature has not risen in the twenty-first century, challenging the prevailing view that anthropogenic forcing causes climate warming”.

Yu Kosaka & Shang-Ping Xie, Recent global-warming hiatus tied to equatorial Pacific surface cooling, Nature Letter (2013),

doi:10.1038/nature12534

Despite the continued increase in atmospheric greenhouse gas concentrations, the annual-mean global temperature has not risen in the twenty-first century, challenging the prevailing view that anthropogenic forcing causes climate warming. Various mechanisms have been proposed for this hiatus in global warming, but their relative importance has not been quantified, hampering observational estimates of climate sensitivity. Here we show that accounting for recent cooling in the eastern equatorial Pacific reconciles climate simulations and observations. We present a novel method of uncovering mechanisms for global temperature change by prescribing, in addition to radiative forcing, the observed history of sea surface temperature over the central to eastern tropical Pacific in a climate model. Although the surface temperature prescription is limited to only 8.2% of the global surface, our model reproduces the annual-mean global temperature remarkably well with correlation coefficient r = 0.97 for 1970–2012 (which includes the current hiatus and a period of accelerated global warming). Moreover, our simulation captures major seasonal and regional characteristics of the hiatus, including the intensified Walker circulation, the winter cooling in northwestern North America and the prolonged drought in the southern USA. Our results show that the current hiatus is part of natural climate variability, tied specifically to a La-Niña-like decadal cooling. Although similar decadal hiatus events may occur in the future, the multi-decadal warming trend is very likely to continue with greenhouse gas increase.

Integrated Assessment Climate models tell us “very little”

August 24, 2013

Mathematical models are used – and used successfully – everyday in Engineering, Science, Medicine and Business. Their usefulness is determined – and some are extremely useful – by knowing their limitations and acknowledging that they only represent an approximation of real complex systems.  Actual measurements always override the model results and whenever reality does not agree with model predictions it is usually mandatory to adjust the model. Where the adjustments can only be made by using “fudge factors” it is usually necessary to revisit the simplifying assumptions used to formulate the model in the first place.

But this is not how Climate Modelling Works. Reality or actual measurements are not allowed to disturb the model or its results for the far future. Fudge factors galore are introduced to patch over the differences when they appear. The adjustments to the model are just sufficient to cover the observed difference to reality but such that the long-term “result” is maintained.

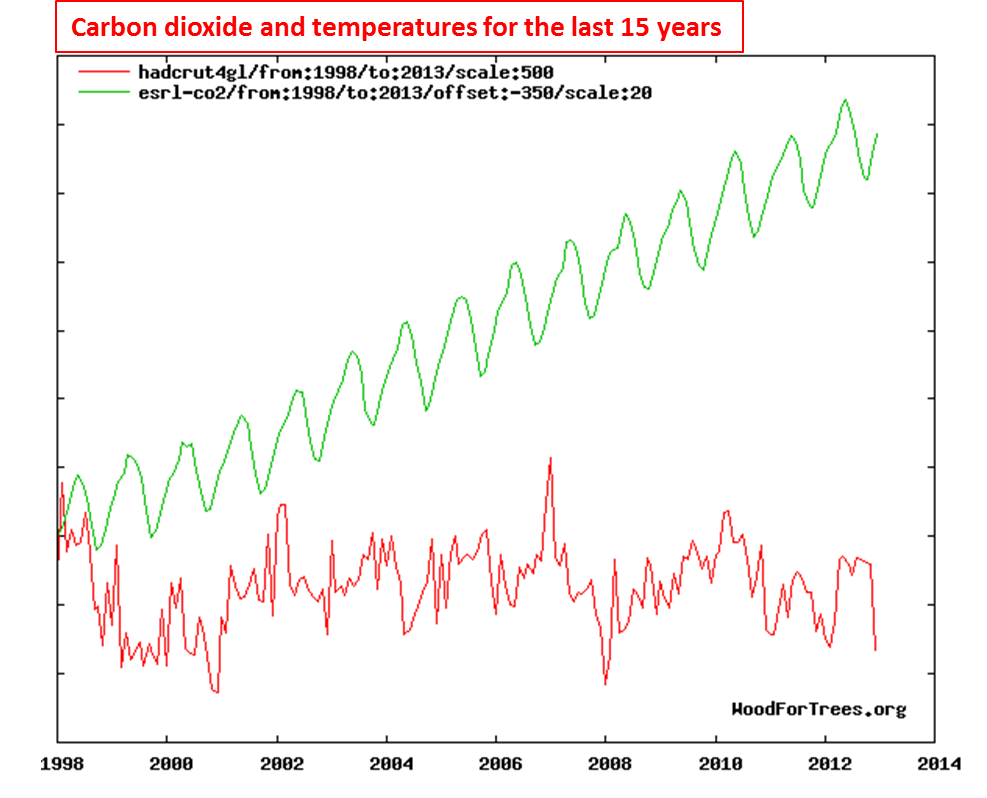
The assumption that carbon dioxide has a significant role to play in global warming is itself hypothetical. Climate models start with that as an assumption. They don’t address whether there is a link between the two. Some level of warming is assumed to be the consequence of a doubling the carbon dioxide concentration in the atmosphere. For the last 17 years global temperature has stood still while carbon dioxide concentration has increased dramatically. There is actually more evidence to hypothesise that there is no link (or a very weak link) between carbon dioxide and global warming than that there is. Nevertheless all climate models start with the built-in assumption that the link exists. And then use the results of the model as proof that the link exists! They are not just cyclical arguments – they are incestuous – or do I mean cannibalistic.

It is bad enough that economic models, developed to count the cost of carbon dioxide are first based on some hypothetical magnitude of the link between carbon dioxide emission and global warming as their starting point. But it gets worse. These “integrated assessment” models then themselves are strewn with new assumptions and further cyclical logic as to how the costs ensue.

A new paper by Prof. Robert Pindyck for the National Bureau of Economic Research takes a less than admiring look at the Integrated Assessment Climate models and their uselessness.

Robert S. PindyckClimate Change Policy: What Do the Models Tell Us?, NBER Working Paper No. 19244
Issued in July 2013

(A pdf of the full paper is here: Climate-Change-Policy-What-Do-the-Models-Tell-Us)

Abstract: Very little. A plethora of integrated assessment models (IAMs) have been constructed and used to estimate the social cost of carbon (SCC) and evaluate alternative abatement policies. These models have crucial flaws that make them close to useless as tools for policy analysis: certain inputs (e.g. the discount rate) are arbitrary, but have huge effects on the SCC estimates the models produce; the models’ descriptions of the impact of climate change are completely ad hoc, with no theoretical or empirical foundation; and the models can tell us nothing about the most important driver of the SCC, the possibility of a catastrophic climate outcome. IAM-based analyses of climate policy create a perception of knowledge and precision, but that perception is illusory and misleading.

Even though his assumptions about “climate sensitivity” are somewhat optimistic, he is more concerned with the assumptions made to try and develop the “damage” function to enable the cost to be estimated:

When assessing climate sensitivity, we at least have scientific results to rely on, and can argue coherently about the probability distribution that is most consistent with those results. When it comes to the damage function, however, we know almost nothing, so developers of IAMs [Integrated Assessment Models] can do little more than make up functional forms and corresponding parameter values. And that is pretty much what they have done. …..  

But remember that neither of these loss functions is based on any economic (or other) theory. Nor are the loss functions that appear in other IAMs. They are just arbitrary functions, made up to describe how GDP goes down when T goes up.

…. Theory can’t help us, Nor is data available that could be used to estimate or even roughly calibrate the parameters. As a result, the choice of values for these parameters is essentially guesswork. The usual approach is to select values such that L(T ) for T in the range of 2◦C to 4◦C is consistent with common wisdom regarding the damages that are likely to occur for small to moderate increases in temperature.

…… For example, Nordhaus (2008) points out (page 51) that the 2007 IPCC report states that “global mean losses could be 1–5% GDP for 4◦C of warming.” But where did the IPCC get those numbers? From its own survey of several IAMs. Yes, it’s a bit circular. 

The bottom line here is that the damage functions used in most IAMs are completely made up, with no theoretical or empirical foundation. That might not matter much if we are looking at temperature increases of 2 or 3◦C, because there is a rough consensus (perhaps completely wrong) that damages will be small at those levels of warming. The problem is that these damage functions tell us nothing about what to expect if temperature increases are larger, e.g., 5◦C or more.19 Putting T = 5 or T = 7 into eqn. (3) or (4) is a completely meaningless exercise. And yet that is exactly what is being done when IAMs are used to analyze climate policy.

And he concludes:

I have argued that IAMs are of little or no value for evaluating alternative climate change policies and estimating the SCC. On the contrary, an IAM-based analysis suggests a level of knowledge and precision that is nonexistent, and allows the modeler to obtain almost any desired result because key inputs can be chosen arbitrarily. 

As I have explained, the physical mechanisms that determine climate sensitivity involve crucial feedback loops, and the parameter values that determine the strength of those feedback loops are largely unknown. When it comes to the impact of climate change, we know even less. IAM damage functions are completely made up, with no theoretical or empirical foundation. They simply reflect common beliefs (which might be wrong) regarding the impact of 2◦C or 3◦C of warming, and can tell us nothing about what might happen if the temperature increases by 5◦C or more. And yet those damage functions are taken seriously when IAMs are used to analyze climate policy. Finally, IAMs tell us nothing about the likelihood and nature of catastrophic outcomes, but it is just such outcomes that matter most for climate change policy. Probably the best we can do at this point is come up with plausible estimates for probabilities and possible impacts of catastrophic outcomes. Doing otherwise is to delude ourselves.

….

Increasing Antarctic sea ice correlates with global cooling

August 18, 2013

A new paper shows that for the last 30 years Antarctic ice is increasing and correlates best with a cooling global temperature.

Qi Shu, Fangli Qiao, Zhenya Song and Chunzai Wang, Sea ice trends in the Antarctic and their relationship to surface air temperature during 1979–2009, Clim Dyn (2012) 38:2355–2363, DOI 10.1007/s00382-011-1143-9

Abstract: Surface air temperature (SAT) from four reanalysis/analysis datasets are analyzed and compared with the observed SAT from 11 stations in the Antarctic. It is found that the SAT variation from Goddard Institute for Space Studies (GISS) is the best to represent the observed SAT. Then we use the sea ice concentration (SIC) data from satellite measurements, the SAT data from the GISS dataset and station observations to examine the trends and variations of sea ice and SAT in the Antarctic during 1979–2009. The Antarctic sea ice extent (SIE) shows an increased trend during 1979–2009, with a trend rate of 1.36 ± 0.43% per decade. Ensemble empirical mode decomposition analysis shows that the rate of the increased trend has been accelerating in the past decade. Antarctic SIE trend depends on the season, with the maximum increase occurring in autumn. If the relationship between SIC and GISS SAT trends is examined regionally, Antarctic SIC trends agree well with the local SAT trends in the most Antarctic regions. That is, Antarctic SIC and SAT show an inverse relationship: a cooling (warming) SAT trend is associated with an upward (downward) SIC trend.

The variations of local  SIC and SAT anomalies in autumn during the past 30 years

The variations of local
SIC and SAT anomalies in
autumn during the past 30 years

Summary: ….

The SAT and SIC trends illustrate an inverse relationship in most of the Antarctic regions, especially in summer and autumn. This indicates that a cooling (warming) SAT trend is associated with an upward (downward) SIC trend in the Antarctic. The station observations also confirm the inverse relationship between SAT and SIC. In most of the Antarctic regions, a cooling trend of SAT in summer and autumn is associated with an increased trend of SIC. …

Our analyses show that the relationship between sea ice and SAT trends should be examined regionally rather than integrally.