Posts Tagged ‘IPCC’

Global warming hiatus confirmed – now the Pacific is to “blame”

August 28, 2013

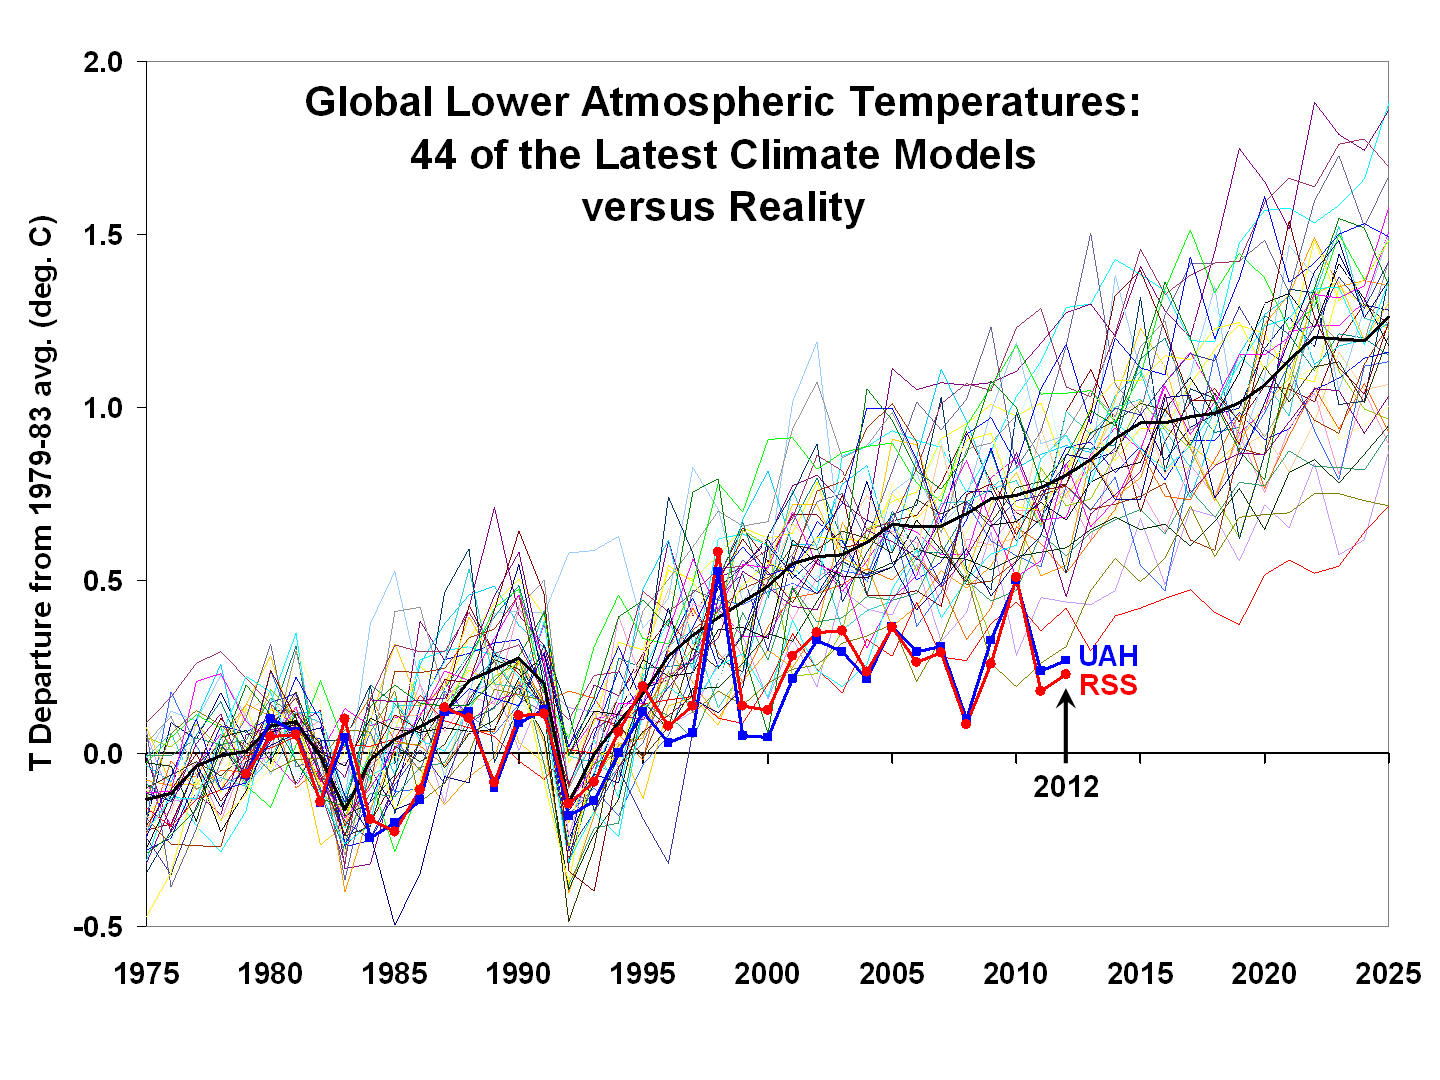
Speculation is rife as to why there has been no global warming for the last 17 or 18 years. Some of this speculation is by those who believe the science is settled and is merely to try and “save” the discredited climate models used by the IPCC. Others – the real scientists – actually use it as an opportunity to investigate something that is not very well understood at all.

The lack of warming has been “blamed” on a variety of reasons. Some have blamed mysterious heat storage in the deep ocean where the heat has actually been transported from and through colder temperatures to higher temperatures! Others say that aerosols and soot in the atmosphere – due to pollution – have distorted the warming trend by hiding the sun. Some few point out that the models really don’t know how to treat clouds and moisture in the atmosphere and what actually drives cloud formation is still an unknown unknown. And there are those – like me – who put it down to natural variation which in turn is ultimately driven – via many still unknown mechanisms – by the Sun.

The El Nino-Southern Oscillation, has a major impact on global climate and is usually acknowledged but a new paper in Nature now suggests that the lack of warming is due to the Pacific Decadal Oscillation that lasts for a much longer period of time (15 – 30 years).  There may well be some influence of the Pacific Decadal Oscillation and no doubt it should be investigated further. But it does first need an acknowledgement that there is something to be investigated. As the authors begin “Despite the continued increase in atmospheric greenhouse gas concentrations, the annual-mean global temperature has not risen in the twenty-first century, challenging the prevailing view that anthropogenic forcing causes climate warming”.

Yu Kosaka & Shang-Ping Xie, Recent global-warming hiatus tied to equatorial Pacific surface cooling, Nature Letter (2013),

doi:10.1038/nature12534

Despite the continued increase in atmospheric greenhouse gas concentrations, the annual-mean global temperature has not risen in the twenty-first century, challenging the prevailing view that anthropogenic forcing causes climate warming. Various mechanisms have been proposed for this hiatus in global warming, but their relative importance has not been quantified, hampering observational estimates of climate sensitivity. Here we show that accounting for recent cooling in the eastern equatorial Pacific reconciles climate simulations and observations. We present a novel method of uncovering mechanisms for global temperature change by prescribing, in addition to radiative forcing, the observed history of sea surface temperature over the central to eastern tropical Pacific in a climate model. Although the surface temperature prescription is limited to only 8.2% of the global surface, our model reproduces the annual-mean global temperature remarkably well with correlation coefficient r = 0.97 for 1970–2012 (which includes the current hiatus and a period of accelerated global warming). Moreover, our simulation captures major seasonal and regional characteristics of the hiatus, including the intensified Walker circulation, the winter cooling in northwestern North America and the prolonged drought in the southern USA. Our results show that the current hiatus is part of natural climate variability, tied specifically to a La-Niña-like decadal cooling. Although similar decadal hiatus events may occur in the future, the multi-decadal warming trend is very likely to continue with greenhouse gas increase.

Integrated Assessment Climate models tell us “very little”

August 24, 2013

Mathematical models are used – and used successfully – everyday in Engineering, Science, Medicine and Business. Their usefulness is determined – and some are extremely useful – by knowing their limitations and acknowledging that they only represent an approximation of real complex systems.  Actual measurements always override the model results and whenever reality does not agree with model predictions it is usually mandatory to adjust the model. Where the adjustments can only be made by using “fudge factors” it is usually necessary to revisit the simplifying assumptions used to formulate the model in the first place.

But this is not how Climate Modelling Works. Reality or actual measurements are not allowed to disturb the model or its results for the far future. Fudge factors galore are introduced to patch over the differences when they appear. The adjustments to the model are just sufficient to cover the observed difference to reality but such that the long-term “result” is maintained.

The assumption that carbon dioxide has a significant role to play in global warming is itself hypothetical. Climate models start with that as an assumption. They don’t address whether there is a link between the two. Some level of warming is assumed to be the consequence of a doubling the carbon dioxide concentration in the atmosphere. For the last 17 years global temperature has stood still while carbon dioxide concentration has increased dramatically. There is actually more evidence to hypothesise that there is no link (or a very weak link) between carbon dioxide and global warming than that there is. Nevertheless all climate models start with the built-in assumption that the link exists. And then use the results of the model as proof that the link exists! They are not just cyclical arguments – they are incestuous – or do I mean cannibalistic.

It is bad enough that economic models, developed to count the cost of carbon dioxide are first based on some hypothetical magnitude of the link between carbon dioxide emission and global warming as their starting point. But it gets worse. These “integrated assessment” models then themselves are strewn with new assumptions and further cyclical logic as to how the costs ensue.

A new paper by Prof. Robert Pindyck for the National Bureau of Economic Research takes a less than admiring look at the Integrated Assessment Climate models and their uselessness.

Robert S. PindyckClimate Change Policy: What Do the Models Tell Us?, NBER Working Paper No. 19244
Issued in July 2013

(A pdf of the full paper is here: Climate-Change-Policy-What-Do-the-Models-Tell-Us)

Abstract: Very little. A plethora of integrated assessment models (IAMs) have been constructed and used to estimate the social cost of carbon (SCC) and evaluate alternative abatement policies. These models have crucial flaws that make them close to useless as tools for policy analysis: certain inputs (e.g. the discount rate) are arbitrary, but have huge effects on the SCC estimates the models produce; the models’ descriptions of the impact of climate change are completely ad hoc, with no theoretical or empirical foundation; and the models can tell us nothing about the most important driver of the SCC, the possibility of a catastrophic climate outcome. IAM-based analyses of climate policy create a perception of knowledge and precision, but that perception is illusory and misleading.

Even though his assumptions about “climate sensitivity” are somewhat optimistic, he is more concerned with the assumptions made to try and develop the “damage” function to enable the cost to be estimated:

When assessing climate sensitivity, we at least have scientific results to rely on, and can argue coherently about the probability distribution that is most consistent with those results. When it comes to the damage function, however, we know almost nothing, so developers of IAMs [Integrated Assessment Models] can do little more than make up functional forms and corresponding parameter values. And that is pretty much what they have done. …..  

But remember that neither of these loss functions is based on any economic (or other) theory. Nor are the loss functions that appear in other IAMs. They are just arbitrary functions, made up to describe how GDP goes down when T goes up.

…. Theory can’t help us, Nor is data available that could be used to estimate or even roughly calibrate the parameters. As a result, the choice of values for these parameters is essentially guesswork. The usual approach is to select values such that L(T ) for T in the range of 2◦C to 4◦C is consistent with common wisdom regarding the damages that are likely to occur for small to moderate increases in temperature.

…… For example, Nordhaus (2008) points out (page 51) that the 2007 IPCC report states that “global mean losses could be 1–5% GDP for 4◦C of warming.” But where did the IPCC get those numbers? From its own survey of several IAMs. Yes, it’s a bit circular. 

The bottom line here is that the damage functions used in most IAMs are completely made up, with no theoretical or empirical foundation. That might not matter much if we are looking at temperature increases of 2 or 3◦C, because there is a rough consensus (perhaps completely wrong) that damages will be small at those levels of warming. The problem is that these damage functions tell us nothing about what to expect if temperature increases are larger, e.g., 5◦C or more.19 Putting T = 5 or T = 7 into eqn. (3) or (4) is a completely meaningless exercise. And yet that is exactly what is being done when IAMs are used to analyze climate policy.

And he concludes:

I have argued that IAMs are of little or no value for evaluating alternative climate change policies and estimating the SCC. On the contrary, an IAM-based analysis suggests a level of knowledge and precision that is nonexistent, and allows the modeler to obtain almost any desired result because key inputs can be chosen arbitrarily. 

As I have explained, the physical mechanisms that determine climate sensitivity involve crucial feedback loops, and the parameter values that determine the strength of those feedback loops are largely unknown. When it comes to the impact of climate change, we know even less. IAM damage functions are completely made up, with no theoretical or empirical foundation. They simply reflect common beliefs (which might be wrong) regarding the impact of 2◦C or 3◦C of warming, and can tell us nothing about what might happen if the temperature increases by 5◦C or more. And yet those damage functions are taken seriously when IAMs are used to analyze climate policy. Finally, IAMs tell us nothing about the likelihood and nature of catastrophic outcomes, but it is just such outcomes that matter most for climate change policy. Probably the best we can do at this point is come up with plausible estimates for probabilities and possible impacts of catastrophic outcomes. Doing otherwise is to delude ourselves.

….

“But measuring rainfall is very tricky,” – Kerry Emanuel

August 19, 2013

It’s the tail wagging the dog, or the cart before the horse as the IPCC prepares to publish its report.

It’s the brave new world of Global warming – though global temperatures have been still or have declined slightly over the last 17 years. But it is 95% certain – says the IPCC –  that carbon dioxide is the cause and the world has warmed by 0.8 °C since the 1950’s. But that 95% is plucked from the air. But they are certain – from their models that the world will warm by upto 4°C in the next 100 years — and that carbon dioxide is the cause! We know the cause but we don’t know the effects!

The local effects are elusive.

“But measuring rainfall is very tricky,” said Kerry Emanuel

Reuters: 

Experts surer of manmade global warming but local predictions elusive

Climate scientists are surer than ever that human activity is causing global warming, according to leaked drafts of a major U.N. report, but they are finding it harder than expected to predict the impact in specific regions in coming decades. ….

…. Drafts seen by Reuters of the study by the U.N. panel of experts, due to be published next month, say it is at least 95 percent likely that human activities – chiefly the burning of fossil fuels – are the main cause of warming since the 1950s.

But they will merely ignore the real observation that global temperatures have not increased for at least 17 years.

“We have got quite a bit more certain that climate change … is largely manmade,” said Reto Knutti, a professor at the Swiss Federal Institute of Technology in Zurich. “We’re less certain than many would hope about the local impacts.”

And gauging how warming would affect nature, from crops to fish stocks, was also proving hard since it goes far beyond physics. “You can’t write an equation for a tree,” he said.

How exactly the certainty increased when temperatures did not go up while carbon dioxide concentration continued to increase is of no consequence – apparently. How certainty increases when the models are diverging more and more from reality is another mystery.

The IPCC report, the first of three to be released in 2013 and 2014, will face intense scrutiny, particularly after the panel admitted a mistake in the 2007 study which wrongly predicted that all Himalayan glaciers could melt by 2035. Experts say the error far overestimated the melt and might have been based on a misreading of 2350.

The new study will state with greater confidence than in 2007 that rising manmade greenhouse gas emissions have already meant more heatwaves. But it is likely to play down some tentative findings from 2007, such as that human activities have contributed to more droughts. ….

Drew Shindell, a NASA climate scientist, said the relative lack of progress in regional predictions was the main disappointment of climate science since 2007.

“I talk to people in regional power planning. They ask: ‘What’s the temperature going to be in this region in the next 20-30 years, because that’s where our power grid is?'” he said.

“We can’t really tell. It’s a shame,” said Shindell. Like the other scientists interviewed, he was speaking about climate science in general since the last IPCC report, not about the details of the latest drafts.

WARMING SLOWING

The panel will try to explain why global temperatures, while still increasing, have risen more slowly since about 1998 even though greenhouse gas concentrations have hit repeated record highs in that time, led by industrial emissions by China and other emerging nations.

An IPCC draft says there is “medium confidence” that the slowing of the rise is “due in roughly equal measure” to natural variations in the weather and to other factors affecting energy reaching the Earth’s surface.

Scientists believe causes could include: greater-than-expected quantities of ash from volcanoes, which dims sunlight; a decline in heat from the sun during a current 11-year solar cycle; more heat being absorbed by the deep oceans; or the possibility that the climate may be less sensitive than expected to a build-up of carbon dioxide.

“It might be down to minor contributions that all add up,” said Gabriele Hegerl, a professor at Edinburgh University. Or maybe, scientists say, the latest decade is just a blip.

Or maybe the Anthropogenic Global Warming meme is just plain wrong.

The main scenarios in the draft, using more complex computer models than in 2007 and taking account of more factors, show that temperatures could rise anywhere from a fraction of 1 degree Celsius (1.8 Fahrenheit) to almost 5C (9F) this century, a wider range at both ends than in 2007.

The low end, however, is because the IPCC has added what diplomats say is an improbable scenario for radical government action – not considered in 2007 – that would require cuts in global greenhouse gases to zero by about 2070.

Temperatures have already risen by 0.8C (1.4F) since the Industrial Revolution in the 19th century.

Experts say that the big advance in the report, due for a final edit by governments and scientists in Stockholm from September 23-26, is simply greater confidence about the science of global warming, rather than revolutionary new findings.

SEA LEVELS

“Overall our understanding has strengthened,” said Michael Oppenheimer, a professor at Princeton University, pointing to areas including sea level rise.

An IPCC draft projects seas will rise by between 29 and 82 cm (11.4 to 32.3 inches) by the late 21st century – above the estimates of 18 to 59 cm in the last report, which did not fully account for changes in Antarctica and Greenland.

The report slightly tones down past tentative findings that more intense tropical cyclone are linked to human activities. Warmer air can contain more moisture, however, making downpours more likely in future.

“There is widespread agreement among hurricane scientists that rainfall associated with hurricanes will increase noticeably with global warming,” said Kerry Emanuel, of the Massachusetts Institute of Technology.

“But measuring rainfall is very tricky,” he said.

Simple harmonic model – without carbon dioxide – fits reality better than the IPCC climate models

August 16, 2013

A new post at the Norwegian GeoForskning (Geological Research) site by Jan-Erik Solheim and Ole Humlum is quite significant I think. Solheim is Professor (emeritus) at  Institutt for teoretisk astrofysikk, University of Oslo while Humlum is professor of Physical Geography at the University of Oslo and an adjunct Professor at UNIS (University Centre in Svalbard). The post shows that a simple harmonic model (movements of the sun, moon and planets together with linear trends) provides a better fit to the global temperature data since 1850 and likely a better predictor than the assembly of 44 climate models used by the IPCC. They find no signal since the 1950’s which could correspond to any significant impact of carbon dioxide concentration and find no need to include such an influence. If such an effect is present its influence is miniscule.

Models need to be parsimonius to exclude parameters and mechanisms whose effects cannot be discerned. Otherwise they cannot be anchored in reality. A problem with many of the so-called climate models is that they include hypothetical effects which cannot be discerned in the available data, then apply forcing feedbacks to such hypothetical effects and then conclude that the results are valid!

If we’d had a warming due to CO2, this should appear as a deviation from the simple harmonic model since 1950. There are no signs of any additional heating due to CO2 as IPCC claims in their reports. Also CO2 effects of climate models for the IPCC based are exaggerated. The net effect of CO2 is thus so modest that it can not be seen in this data.

A simple, empirical, harmonic climate model

by Jan-Erik Solheim and Ole Humlum

(The paper is in Norwegian and this English version is from the HockeySchtick)
(more…)

The lunar nodal cycle and its effects on climate

July 27, 2013

A paper has just been published in the International Journal of Climatology showing that the lunar nodal cycle influences “the low-frequency summer rainfall variability over the plains to the east of subtropical Andes, in South America, through long-term sea surface temperature (SST) variations induced by the nodal amplitude of diurnal tides over southwestern South Atlantic (SWSA).”

Eduardo Andres Agosta, The 18.6-year nodal tidal cycle and the bi-decadal precipitation oscillation over the plains to the east of subtropical Andes, South America, International J of Climatology, DOI: 10.1002/joc.3787

Abstract: This work shows statistical evidence for lunar nodal cycle influence on the low-frequency summer rainfall variability over the plains to the east of subtropical Andes, in South America, through long-term sea surface temperature (SST) variations induced by the nodal amplitude of diurnal tides over southwestern South Atlantic (SWSA). In years of strong (weak) diurnal tides, tide-induced diapycnal mixing makes SST cooler (warmer) together with low (high) air pressures in the surroundings of the Malvinas/Falklands Islands in the SWSA, possibly through mean tropospheric baroclinicity variations. As the low-level tropospheric circulation anomalies directly affect the interannual summer rainfall variability, such an influence can be extended to the bi-decadal variability present in the summer rainfall owing to the nodal modulation effect observed in the tropospheric circulation. The identification of the nodal periodicity in the summer rainfall variability is statistically robust.

The lunar nodal cycle is not something that is very well known but it is another celestial cycle which is clearly not to be ignored. Naturally the IPCC takes no notice of solar cycles, planetary cycles or lunar cycles and all these are lumped into what could be considered “natural variability”.

(Sourced from Wikipedia)

The lunar orbit is inclined by about 5 degrees on the ecliptic. The moon  therefore can lie up to about 5 degrees north or south of the ecliptic. The ecliptic is the plane of the apparent path of the Sun on the celestial sphere, and is coplanar with both the orbit of the Earth around the Sun and the apparent orbit of the Sun around the Earth.

File:Lunar eclipse diagram-en.svg

Lunar eclipse orbital diagram: wikipedia

The lunar nodes precess around the ecliptic, completing a revolution (called a draconitic or nodical period, the period of nutation) in 6793.5 days or 18.5996 years.

The effects of the 18.6 year lunar nodal cycle on climate on tides and geological sediments and on weather and climate have long been of interest (though not apparently for the IPCC).

Nanocycles Method is the English translation of the title of a book published in Russian by Professor of Geology S Afanasiev of Moscow University in 1991,ISBN 5–7045–0109–0.

From “Nanocycles Method” by S Afanasiev, 1991

The lunar node cycle, which is presently 18.6 years, affects the rainfall on a 9.3 year cycle and this shows up as varying thickness layers of deposits, or varves, in geological formations. 

However the moon’s orbit is gradually getting larger over time and so its period is slowing down. The rate of movement of the nodes is also decelerating and Prof Afanasiev has determined the accurate nodal cycle period for the whole of the last 600 million years.

The cycle of the lunar node is important in affecting the weather because it plays a part in determining tides in the atmosphere, oceans and solid body of the earth. The atmospheric tides affect rainfall which in turn affects river flows and hence the deposition of geological varves, or annual deposits in geological layers. ….. 

At the present time, with a nodal cycle of 9.3 years, successive nodal cycles begin 0.3 years later in the seasons each cycle. Therefore after 3 or 4 cycles the nodal cycle start return to the same time of year again. The average period of the cycle when the nodal cycle comes at the same time of year is 9.3/0.3 or 31 years. Specific occurrences of nearly the same season, within 0.1 year, will occur after 28, 65 and 93 years and so on. 

…. Because the lunar nodal cycle period has changed from 9.147 years to 9.298 years in the last 1.0 million years, the secondary cycle has varied from 62.12 years to 31.21 years. If this cycle can be measured in a deposit to an accuracy of 1 year then it allows the dating of the deposit to an accuracy of +/-0.03 million years.

A small selection of papers dealing with the effects of the 18.6 year lunar nodal cycle is given below:

Beware Global Cooling

July 1, 2013
File:Hendrick Avercamp - Frozen River with Skaters - Google Art Project.jpg

Hendrick Avercamp – Frozen River with Skaters

Andrew McKillop has a new article posted at The Market Oracle.

Global cooling began at the end of the so-called Medieval Warm Period, by or before the year 1300, and was preceded by at least 200 years, and as long as 350 years, of warming on the same variable and unpredictable basis. Measurement problems include the type of proxies used – ice cores, tree rings, corals and shells, others – but at least as important, the ideological bias of climate science leads to extreme variations in reconstructed climate data for the same region, same period. One flagrant example is IPCC treatment of Medieval Warming Period data – as published by the IPCC in different editions of its reports and studies. Before year 2000, IPCC studies include papers showing Warm Period temperatures in certain high latitude locations at certain dates around 950-1200 as several full degrees celsius above present day temperatures.

That is, despite 213 years of anthropogenic global warming if with the IPCC we use a start date of 1800 for human “carbon pollution of the atmosphere”, we have in no way matched this natural warming. Which needed zero assistance from human-source CO2.

This is the global cooling fear

Flooding in the low countries in Europe was a common feature which accompanied the global cooling which succeeded the Medieval Warm Period. The cooling period he writes, lasted 450 years.

(more…)

Chaos of climate models only shows that “we don’t know what we don’t know”

April 17, 2013

I spent a large part of my early career in mathematical modelling (of combustion systems and of heat flow) and have a very clear idea of what models can do and what they can’t. Models after all are used primarily to simplify complex systems which are otherwise intractable. They are – always – severely limited by the assumptions and simplifying approximations that have to be introduced. Models are a powerful tool for investigation but are only as good as their most inaccurate assumption. But they are a tool primarily for investigation — and can be dangerous when used for decision making based on their imperfect predictions. The spectacular failures of mathematical models of the global economy are a case in point. It is worth noting that in spite of the great strides made in weather forecasting  for example – much of which is empirical – the simple statement that “tomorrows weather will be like today’s”  is as correct – statistically – as the most complex model running on some super-computer somewhere.

It has therefore always amazed me that so-called “scientists” would be so certain about their approximate models of climate systems – which are perhaps as complex, chaotic and “unknown” systems as any one could study. It has been a boon for politicians looking for new ways of raising revenue. It has been exploited by the alarmists since the alarmist predictions cannot be tested. The wide spread of results from climate models is rarely mentioned.

When reality does not match model forecasts it is time to back off and rethink the models and hopefully they will be better next time. And it is time to back track from all the political decisions made on the basis of patently incomplete and inaccurate models.

The simple reality about climate is that rather than being a “settled science”

  • we don’t know the impact of solar effects on climate
  • we don’t know the impact of clouds or even if they are net “warmers” or net “coolers”
  • we don’t know how much of the earth’s radiative energy balance is dependent upon carbon dioxide
  • we don’t know how much carbon dioxide is absorbed  by the oceans and living things
  • we don’t know the impact of aerosols and particles in the atmosphere
  • we don’t know the role of the oceans in transporting heat around the globe
  • we don’t know how much heat is stored in the oceans and how it varies
  • we don’t know the impact of solar effects on cloud formation
  • we don’t know what triggers ice ages, and
  • we don’t know what we don’t know.

This from Dr. Roy Spencer and the ridiculously wide spread of the model results and the obvious deviation of reality from model results are particularly striking:

Global Warming Slowdown: The View from Space

Since the slowdown in surface warming over the last 15 years has been a popular topic recently, I thought I would show results for the lower tropospheric temperature (LT) compared to climate models calculated over the same atmospheric layers the satellites sense.

Courtesy of John Christy, and based upon data from the KNMI Climate Explorer, below is a comparison of 44 climate models versus the UAH and RSS satellite observations for global lower tropospheric temperature variations, for the period 1979-2012 from the satellites, and for 1975 – 2025 for the models:

CMIP5-global-LT-vs-UAH-and-RSS

CMIP5-global-LT-vs-UAH-and-RSS

Clearly, there is increasing divergence over the years between the satellite observations (UAH, RSS) and the models. The reasons for the disagreement are not obvious, since there are at least a few possibilities:

……… 

The dark line in the above plot is the 44-model average, and it approximately represents what the IPCC uses for its official best estimate of projected warming. Obviously, there is a substantial disconnect between the models and observations for this statistic.

I find it disingenuous for those who claim that, because not ALL of individual the models disagree with the observations, the models are somehow vindicated. What those pundits fail to mention is that the few models which support weaker warming through 2012 are usually those with lower climate sensitivity.

So, if you are going to claim that the observations support some of the models, and least be honest and admit they support the models that are NOT consistent with the IPCC best estimates of warming.

Questioning global warming dogma is taboo in Belgium

April 15, 2013

Reproduced from The GWPF  because “questioning the impact of mankind on climate change is evidently still a taboo in the French-speaking world”. 

The authors of this paper recently presented their views on climate science at the Royal Academy of Belgium. No French or Belgian newspaper was willing to publish their assessment. Questioning the impact of mankind on climate change is evidently still a taboo in the French-speaking world.

Double Standards in Climate Change

István E. Markó a), Alain Préat b), Henri Masson c) and Samuel Furfari d)

a) Professor at the Université catholique de Louvain (UCL)

b) Professor at the Université libre de Bruxelles (ULB)

c) Professor at Maastricht University

d) Lecturer at the Université libre de Bruxelles (ULB)

The conference on climate change held in Doha (Qatar) last December ended in failure once again. However, the news reported in the media about this 18th conference on climate change were fully in line with the well-rehearsed mantra: the Earth is warming up, human emissions of greenhouse gases are mainly to blame for this warming up, and we are approaching disaster. We have only one climate, but communication about it seems to be plagued by double standards.

For a few years now British, American, Italian or German media have given sceptical scientists the opportunity to express their opinions on the validity of the statements released by the Intergovernmental Panel on Climate Change (IPCC), the organisation responsible for the official line of thought on climate matters. Nothing like that has been seen in the French or Belgian media which persist in portraying scientific sceptics, at best as sold out to the oil lobbies, at worst as troubled individuals, greedy for public recognition and fame and as such not worthy to be proponents in a serious debate.

The authors of this contribution were recently been granted the honour of presenting their point of view as climate sceptics at the Royal Academy of Belgium. During a series of six well-attended lectures we showed, among other things, that:

  1. The climate has always changed. This was true during ancient times and it has also been true since the beginning of the modern era. These climate changes have always been, and still are, independent of the concentration of CO2 in the atmosphere;
  2. During Roman times and the Middle Ages temperatures were observed well in excess of those currently experienced. From the 16th till the 19th century a cold period referred to as the “Little Ice Age” predominated. All these changes took place without mankind being held responsible. We believe that the increase in temperatures that occurred during a certain part of the 20th century is the result of a recovery from this cold period. These various events can be explained by a combination of warm and cold cycles of different magnitudes and duration. Why and how this happens is not yet fully understood, but some plausible explanations can be put forward;
  3. The so-called “abnormally rapid” increase in global temperatures between 1980 and 2000 is not unusual at all. There have in fact been several such periods in the past, during which temperatures rose in a similar manner and at comparable rates, even though fossil fuels were not yet in use;
  4. Temperature measurements do not necessarily correlate with a building up or a decrease in heat since heat variations are energy changes subject to thermal inertia. Apart from heat many other parameters have an influence on temperature. Moreover the measurement of temperatures is subject to numerous large errors. When the magnitude and plurality of these measurement errors are taken into account, the reported increase in temperatures is no longer statistically significant;
  5. The famous “Hockey-stick” curve, known as the Mann’s curve and presented six times by the IPCC in its penultimate report, is the result among other things of a mistake in the statistical calculations and an incorrect choice of temperature indicators, i.e. proxies. This lack of scientific rigour has totally discredited the curve and it was withdrawn, without any explanation, from subsequent IPCC reports;
  6. Even though they look formidably complex, the theoretical models employed by the climate modellers are simplified to the extreme. In fact there are far too many (known and unknown) parameters that influence climate change. At the moment it is impossible to take them all into account. The climate system is extremely complex, containing not only chaotic components but also numerous positive and negative feedback loops operating according to various different time scales. Which is why the IPCC wrote in its reports that: “…long-term prediction of future climate states is not possible” (page 774, Third report). This is very true. To this day all the climate predictions based upon these models have turned out to be totally incorrect. Strangely, nobody seems to care;
  7. The relationship between CO2 and temperature, obtained from the Vostok ice cores, shows that a building up of CO2 occurs 800 to 1000 years after an increase in temperature is observed. Hence the increase in the concentration of CO2 is a consequence of the warming of the climate, not its cause;
  8. But the coup de grâce to the “warmists’ theory” – certainly not yet visible in the French and Belgian media – comes from the observation that for the past fifteen years or so the global temperature of the Earth has remained constant. During the same period CO2 emissions have increased by far more than in the past, reaching an unparalleled record this year. Honest climate scientists admit that this observation is an embarrassing inconvenience for their theory. However, attempts to make us believe that the Earth is continuing to warm up persist. Will we have to wait for another twenty, twenty-five or thirty years for the global warming advocates to finally admit that there is no unambiguous correlation between the global temperature of the Earth and human-generated CO2 emissions?
  9. The claim that Hurricane Sandy is due to human CO2 emissions is totally unfounded and has been vigorously contested by numerous meteorologists. This regrettable distortion of the facts has been denounced in an open letter, addressed to the General Secretary of the UN and signed by more than 130 world-renowned scientists, including one of the present authors;
  10. Finally the “abnormal” melting of the Arctic Sea ice, that made the headlines of numerous journals during this summer, was also observed during previous decades. Amazingly the record high increase in Antarctic Sea ice that occurred at exactly the same time has been completely ignored by the very same media. Moreover, no mention has been made of the current, particularly rapid, regeneration of the Arctic Sea ice.

These ten statements are facts. We would be ready to accept that they could be wrong, if evidence were presented to scientifically disprove them. In the meantime, and in view of the lack of coherence and unreliability associated with the numerous predictions made by the IPCC, it is time to set the record straight. The public and politicians must be informed about the hypothetical character of the predominant ‘consensus’ on climate change, which has been uncritically disseminated in the media for more than ten years. If it ever existed, this so-called “climate change consensus” has now been totally undermined by the facts.

Despite the opportunity that we were given by the Royal Academy to raise this issue, we were unable to find any French or Belgian newspaper willing to publish this text. Questioning the impact of mankind on climate change is evidently still a taboo over here.

This article reflects solely the opinions of the Authors.

Climate sensitivity – 10 years on and Pat Michaels et al get their due

April 5, 2013

Back in 2002 a paper in Climate Research by Pat Michaels and his colleagues seriously questioned the sensitivities assumed in the exaggerated IPCC projections for global temperature but the paper was considered heretical and its authors were castigated by the global warming orthodoxy. So Pat Michaels and his colleagues would be more than entitled to an “I told you so” and even some more derisory nose-thumbing at the IPCC.

As Michaels and Knappenberger write at Cato:

Getting Our Due

In the Diary feature of this week’s The Spectatorrational optimist Matt Ridley has a collection of rather random observations from his daily life that have him thinking about (or maybe wishing for since Old Man Winter has been slow to loose his grip in the U.K. and Western Europe, much like he has across the Eastern U.S.) anthropogenic global warming.

What has his attention is that global warming just doesn’t seem to be going according to plan. And for those who have bought into that plan, their plan-driven actions are starting to make them look foolish.

But it’s not as if we haven’t “told you so”—a fact that Ridley draws attention to in the closing segment of his article. ……. 

What we determined in our 2002 study was that the amount of global warming projected by the end of this century was most likely being overestimated.  When we adjusted the climate model projections to take into account and better match the actual observations, our best estimate of the amount of warming we expected from 1990 to 2100 was about 1.8°C (3.2°F), which was in the lower end of the IPCC projected range, and which Ridley correctly noted, we termed as “modest.”

Further, we anticipated the slowdown in the warming rate. ….. 

…… Now, more than 10 years later, more and more evidence is piling in that we were right, including several recent papers that apply a technique not all that dissimilar in theory than our own (e.g. Gillett et al., 2012; Stott et al., 2013).

So even though we still are largely ostracized, at least we rest assured that we were pretty much on target—and some people are starting to take notice.

Revised 21st century temperature projectionsPatrick J. Michaels, Paul C. Knappenberger, Oliver W. Frauenfeld and Robert E. Davis, Climate Research, Vol. 23: 1–9, 2002

Abstract: Temperature projections for the 21st century made in the Third Assessment Report (TAR) of the United Nations Intergovernmental Panel on Climate Change (IPCC) indicate a rise of 1.4 to 5.8°C for 1990–2100. However, several independent lines of evidence suggest that the projections at the upper end of this range are not well supported. Since the publication of the TAR, several findings have appeared in the scientific literature that challenge many of the assumptions that generated the TAR temperature range. Incorporating new findings on the radiative forcing of black carbon (BC) aerosols, the magnitude of the climate sensitivity, and the strength of the climate/carbon cycle feedbacks into a simple upwelling diffusion/energy balance model similar to the one that was used in the TAR, we find that the range of projected warming for the 1990–2100 period is reduced to 1.1–2.8°C. When we adjust the TAR emissions scenarios to include an atmospheric CO2 pathway that is based upon observed CO2 increases during the past 25 yr, we find a warming range of 1.5–2.6°C prior to the adjustments for the new findings. Factoring in these findings along with the adjusted CO2 pathway reduces the range to 1.0–1.6°C. And thirdly, a simple empirical adjustment to the average of a large family of models, based upon observed changes in temperature, yields a warming range of 1.3–3.0°C, with a central value of 1.9°C. The constancy of these somewhat independent results encourages us to conclude that 21st century warming will be modest and near the low and of the IPCC TAR projections.

Prof. Peter A. Ziegler: Solar effects drive climate change not CO2

March 14, 2013
Peter Ziegler

Peter Ziegler: image The Geological Society

Prof. Peter Ziegler (b. 1928) is a Swiss geologist  and Titular Professor of Global Geology at the Geological-Paleontological Institute, University of Basel. He is a member of the Royal Netherlands Academy of Sciences, the Polish Academy of Arts and Sciences, the Russian Academy of Natural Sciences and the Academia Europaea. His presentation on the “Mechanisms of Climate Change” from February this year is pretty self-contained and self explanatory and my comments would only be superfluous.

Climate Change Ziegler 2013 (pdf)

I reproduce his conclusions slide below:

  • Climate change during industrial times can be fully explained by natural processes
  • During the last 550 Million years major natural climate changes involved large fluctuations in temperature and atmospheric CO2 concentrations
  • Apart from orbital forcing and the distribution of continents and oceans, variations in solar activity and the galactic cosmic ray flux controlled climate changes during the geological past and probably still do so
  • Despite rising atmospheric CO2 concentrations we may experience during the coming decades a serious temperature decline akin to the Maunder Minimum due to decreasing solar activity
  • There is overwhelming evidence that Temperature forces the Carbon Cycle and not vice-versa, as postulated by IPCC
  • IPCC underestimates the effects of direct and indirect solar climate forcing but overestimates CO2 forcing by assuming unrealistic positive temperature feedbacks from a concomitant water vapor and cloud increase
  • The IPCC consensus on anthropogenic CO2 emissions causing Global Warming cannot be reconciled with basic data and is therefore challenged