Global warming morphs to climate change which morphs to extreme weather but CO2 is just plain bad!!!
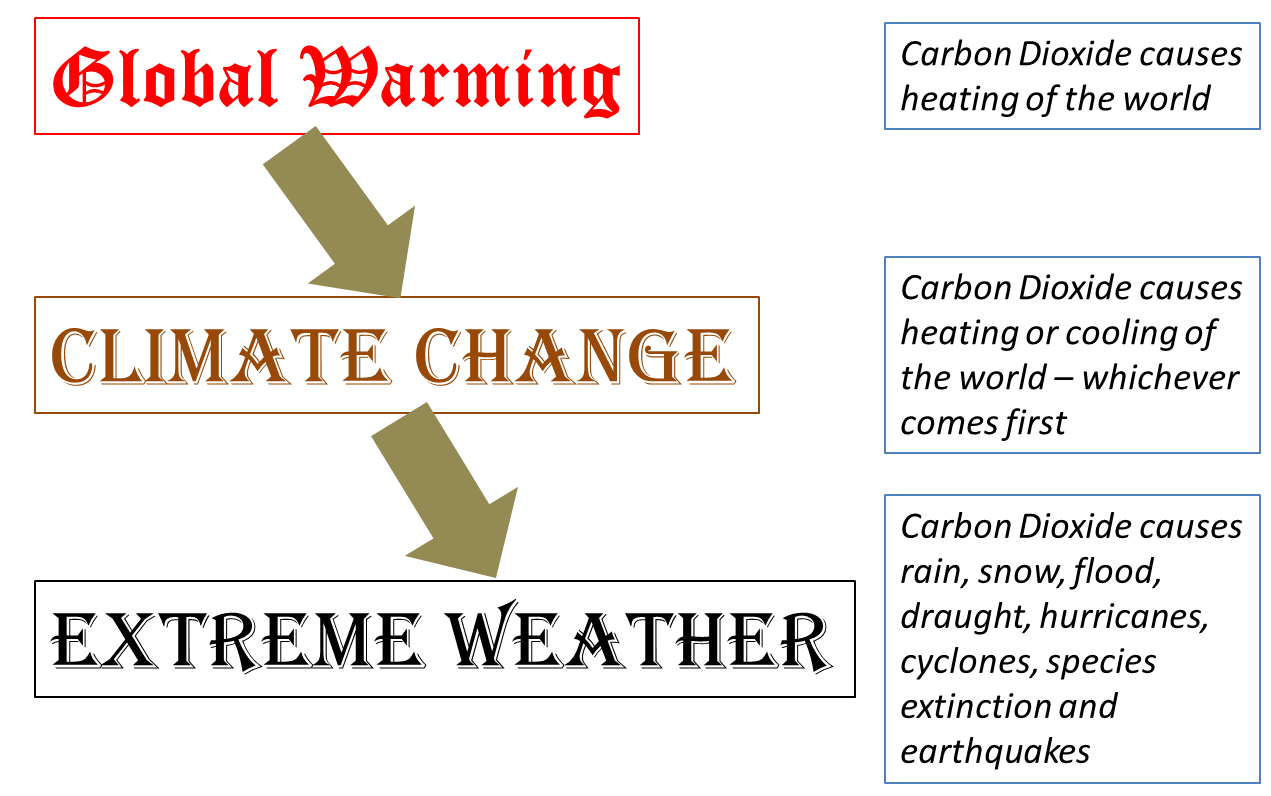
Global warming morphs to climate change which morphs to extreme weather but CO2 is just plain bad!!!
UPDATE! The important point of this story is not whether global warming has stopped or is continuing or if the world is cooling. Climate will go the way it will. The real significance of this story is that climate models are not just far from perfect – they are plain wrong. And what is worse is that when a model is not borne out by reality, the “politically correct” but false assumptions (such as that man-made CO2 causes significant warming or that solar effects are minor) are not even reviewed.
This has been doing the rounds for a few days now but the BBC – which tends to be one of the pillars of the Global Warming religion – has finally come round to reporting that the British Met Office has predicted that global temperatures could decrease somewhat over the next decade. Of course it is good to see that a climate model is being revised in the face of reality. Unfortunately most climate models just retain their assumptions and add fudge factors every time reality fails to meet their forecasts where – instead – they ought to be questioning the very assumptions their models are built on. But that loss of face would be too expensive in terms of the funding already flowing into continuing with discredited models and would be too much to take in one go. But the fundamental requirement of good science is that when models don’t fit it is time to question the assumptions in the model – not to find fudge factors.
BBC: Climate model forecast is revised
The UK Met Office has revised one of its forecasts for how much the world may warm in the next few years. …. If the forecast is accurate, the result would be that the global average temperature would have remained relatively static for about two decades.
…. Climate scientists at the Met Office and other centres are involved in intense research to try to understand what is happening over the most recent period.
The most obvious explanation is natural variability – the cycles of changes in solar activity and the movements and temperatures of the oceans.
Infographic (Met Office): The forecasts are based on a comparison with the average global temperature over the period 1971-2000
Of course the BBC report then goes on to proclaim that this not a global cooling and that global warming will continue.
But of course neither this or any of the other exaggerated models will remove the assumed global warming – man-made carbon dioxide link for which there is no direct evidence whatever.
Carbon dioxide keeps going up while global temperatures decrease.
It’s certainly not rocket science that’s needed.
But unfortunately “climate science” has deteriorated to be nothing much more than “voodoo” science.
Carbon dioxide concentration and global temperature – Source: WoodForTrees.com via http://notrickszone.com/
This paper is about the Warm Period in the Late Bronze Age (3100-3300 Years Before Present), which preceded the Roman Warm Period, the Medieval Warm Period and the current Warm Period.
The influence of climatic change on the Late Bronze Age Collapse and the Greek Dark Ages by Brandon L. Drake, Department of Anthropology, University of New Mexico, Albuquerque
That climate changes and will continue to change is obvious. That this is primarily due to solar effects via the oceans also seems obvious to me. It seems the height of arrogance when – like Canute attempting to hold back the tides – climate-politicians attempt to hold back the sun and its effects. The sun cannot be carbon-taxed into submission.
That CO2 concentration in the atmosphere has little impact on climate is the reality that climate-politicians continue to deny. That the effects of man-made carbon dioxide emissions are of even less significance is becoming increasingly obvious.
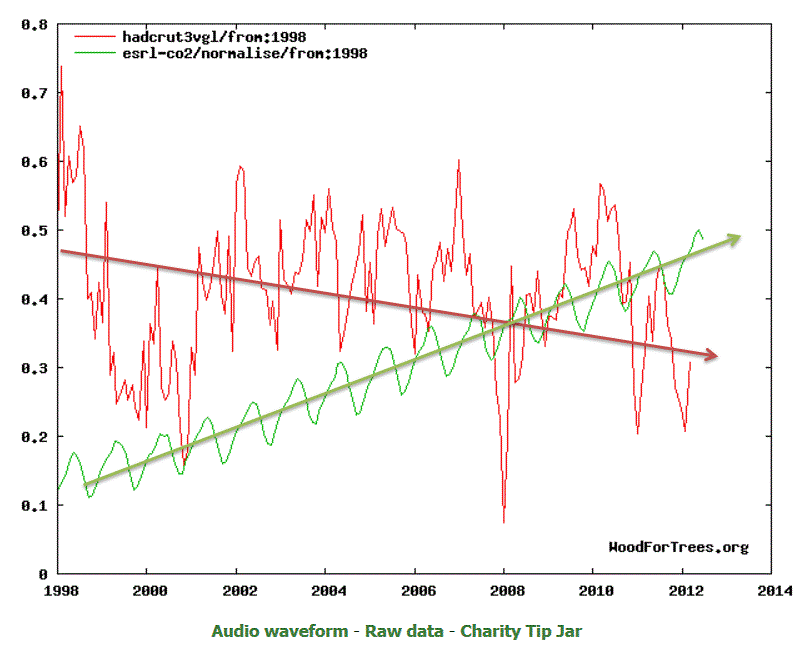
Over the last 16 years global temperatures have been pretty flat (actually the trend is very slightly downwards). During this same time the atmospheric mean CO2 concentration has continued its increasing trend of between 1.5 and 2.5 ppm /year.
The data show no causality between CO2 concentration and global mean temperature. How much or how little man-made emissions of CO2 contribute to the global mean concentration is still open to much question.
Global mean temperatures from woodfortrees.org

Global temperature anomaly hardcrut3vgl (via http://www.woodfortrees.org)
The following plot of mean annual atmospheric CO2 concentrations is from NOAA data
(ftp://ftp.cmdl.noaa.gov/ccg/co2/trends/co2_annmean_mlo.txt)

NOAA ESRL data
A new paper again confirming that the theory that carbon dioxide leads global temperature is misconceived.
” Changes in global atmospheric CO2 are lagging 9.5-10 months behind changes in global air surface temperature. CO2 released from use of fossil fuels have little influence on the observed changes in the amount of atmospheric CO2.”
The phase relation between atmospheric carbon dioxide and global temperature
by Ole Humlum, Kjell Stordahl, Jan-Erik Solheim, Global and Planetary Change
Abstract
Using data series on atmospheric carbon dioxide and global temperatures we investigate the phase relation (leads/lags) between these for the period January 1980 to December 2011. Ice cores show atmospheric CO2variations to lag behind atmospheric temperature changes on a century to millennium scale, but modern temperature is expected to lag changes in atmospheric CO2, as the atmospheric temperature increase since about 1975 generally is assumed to be caused by the modern increase in CO2. In our analysis we use eight well-known datasets; 1) globally averaged well-mixed marine boundary layer CO2 data, 2) HadCRUT3 surface air temperature data, 3) GISS surface air temperature data, 4) NCDC surface air temperature data, 5) HadSST2 sea surface data, 6) UAH lower troposphere temperature data series, 7) CDIAC data on release of anthropogene CO2, and 8) GWP data on volcanic eruptions. Annual cycles are present in all datasets except 7) and 8), and to remove the influence of these we analyze 12-month averaged data. We find a high degree of co-variation between all data series except 7) and 8), but with changes in CO2 always lagging changes in temperature. The maximum positive correlation between CO2 and temperature is found for CO2 lagging 11–12 months in relation to global sea surface temperature, 9.5-10 months to global surface air temperature, and about 9 months to global lower troposphere temperature. The correlation between changes in ocean temperatures and atmospheric CO2 is high, but do not explain all observed changes.
► The overall global temperature change sequence of events appears to be from 1) the ocean surface to 2) the land surface to 3) the lower troposphere.
►Changes in global atmospheric CO2 are lagging about 11–12 months behind changes in global sea surface temperature.
► Changes in global atmospheric CO2 are lagging 9.5-10 months behind changes in global air surface temperature. Changes in global atmospheric CO2 are lagging about 9 months behind changes in global lower troposphere temperature.
► Changes in ocean temperatures appear to explain a substantial part of the observed changes in atmospheric CO2 since January 1980.
► CO2 released from use of fossil fuels have little influence on the observed changes in the amount of atmospheric CO2, and changes in atmospheric CO2 are not tracking changes in human emissions.
I find the blithe assumption – based on supposition and without any evidence – that carbon dioxide has any significant impact on climate, perhaps the most irritating part of the politically correct global warming dogma. I have no objection to it being a hypothesis but it is not rational to take such an hypothesis as fact just “because there is no other explanation”. In fact, solar effects provide most of the “missing” explanation but since solar effects cannot be put down to man and clearly this is politically incorrect!!
Historical data of ice ages shows that carbon dioxide changes lag temperature changes and previously it seemed that the lag might be as long as 700 – 1000 years. Researchers from the University of Copenhagen have published a new paper. The paper suggests that the lag was more likely a few hundred years and less than 400 years. But lag it was. I draw two main conclusions:
Of course this does not prove that increasing carbon dioxide emissions cannot influence temperature. But what it does show is that the primary link between temperature and CO2 is that temperature leads CO2 concentration.
Given that
I find it more plausible that increasing CO2 concentration may well have contributed to neutralising the temperature increase which caused the CO2 emission in the first place.
The greatest climate change the world has seen in the last 100,000 years was the transition from the ice age to the warm interglacial period. New research from the Niels Bohr Institute at the University of Copenhagen indicates that, contrary to previous opinion, the rise in temperature and the rise in the atmospheric CO2 follow each other closely in terms of time. The results have been published in the scientific journal, Climate of the Past. …
It had previously been thought that as the temperature began to rise at the end of the ice age approximately 19,000 years ago, an increase in the amount of CO2 in the atmosphere followed with a delay of up to 1,000 years.
“Our analyses of ice cores from the ice sheet in Antarctica shows that the concentration of CO2 in the atmosphere follows the rise in Antarctic temperatures very closely and is staggered by a few hundred years at most,” explains Sune Olander Rasmussen, Associate Professor and centre coordinator at the Centre for Ice and Climate at the Niels Bohr Institute at the University of Copenhagen.
Tightened constraints on the time-lag between Antarctic temperature and CO2during the last deglaciation by J. B. Pedro, S. O. Rasmussen, and T. D. van Ommen Clim. Past, 8, 1213-1221, 2012
The Hockey Shtick reports on a recent paper by Aldert J. van Beelen and Aarnout J. van Delden of the Institute for Marine and Atmospheric Research Utrecht, Utrecht University, The Netherlands which shows that the hours of sunshine decreased somewhat from 1958-1983 and then increased sharply between 1985 and 2010 at a number of places. The authors postulate that the reduction of cloud cover since 1985 was possibly due to the cleaner air with reduced aerosols during this period.
It was not so long ago that the CERN CLOUD experiments showed that cosmic rays could indeed influence cloud formation providing support for Svensmark’s hypothesis that it is solar effects via cloud formation which dominates climate.
If we assume that the reduction in sunshine hours between 1958 and 1983 was due to man-made pollution and that this was reversed in the period after 1985, it still needs Svensmark’s solar effects or some other mechanism to explain the very sharp reduction in cloud cover and increase in sunshine hours after 1985. It seems patently obvious from every day observations that cloud cover is far more important to weather and climate than any far-fetched notions of man-made carbon dioxide having any significant influence.
The Hockey Shtick: A paper recently published in the journal Weather finds that global summer average sunshine [solar short-wave radiation that reaches Earth’s surface] dimmed during the period 1958-1983 [prompting an ice age scare], but markedly increased from 1985-2010. The increase in summer average sunshine between those two periods is 6 Watts per square meter, which dwarfs the alleged effects of CO2 by more than 5 times. [Alleged CO2 effect from 1958-2010 was calculated using the IPCC formula 5.35*ln(389.78/315) = 1.14 Watts per square meter]. At one measurement site [De Bilt], summer sunshine increased from 1985-2010 by 15 Watts per square meter, more than 23 times the IPCC alleged forcing from CO2 during the same timeframe [5.35*ln(389.78/346.04) = 0.64 Watts per square meter].
The paper states the increase in sunshine reaching the Earth’s surface is due to a decrease in aerosols including clouds, which are influenced by both anthropogenic and natural factors, and possibly changes in solar activity.

from van Beelen and van Delden “Weather” Vol.67 No. 1, January 2012
Stupidity (in introducing cabon trading in the first place) and greed among the carbon traders and speculators reigns supreme.
No surprise!

Reports calls for tougher regulation on carbon trading scheme: image clickgreen.org.uk
Finance sector lobbyists are pushing the European Commission to block tighter regulation of the EU’s carbon market, a new report from Corporate Europe Observatory and Carbon Trade Watch, published today, reveals.
The Commission is currently reviewing regulation of the market following a number of fraud cases and leaked documents suggest that it will include carbon trading under the revised Market in Financial Instruments Directive.
But according to Letting the market play, lobbyists from the International Emissions Trading Association – the main body representing carbon traders – and BusinessEurope have sought to minimise new regulations, with BusinessEurope claiming “no further regulation” is needed.
Report author Oscar Reyes said: “Carbon markets are a playground for fraudsters and speculators. Financial regulations are the Commission’s belated attempt to trim the excesses, but the problems lie at the core. Handing over environmental policy to traders has done nothing to address climate change.” ……..
The report shows that while IETA has blamed a “lack of action from the side of the regulators” for the cases of carbon fraud, its lobby strategy has been driven by a desire to find new opportunities for speculation by whatever means are necessary.
In January 2011, the European Commission halted trading on a key part of the carbon market after the latest in a series of large fraud cases was uncovered. According to Carbon Trade Watch, less than a month later and with the suspension still partly in place, the International Emissions Trading Association (IETA, the main carbon traders’ lobby group) was privately insisting to Brussels officials that “there might be no need to regulate this market”.
There seems to be a renewal of interest in solar effects on climate change and especially on little ice ages. It would be too much to expect an early abandonment of the carbon dioxide hypothesis. Equally unlikely is any acknowledgement that carbon dioxide in the atmosphere is of insignificant influence for climate. But the acknowledgement of solar influences on climate helps to redress some of the balance.
The UK Met office research referred to in yesterday’s Sunday Times article might well refer to this paper in Nature Geoscience published online yesterday which makes the link between UV radiation variation during solar cycles and cold winters in the Northern hemisphere. The authors are from the Met Office Hadley Centre, Oxford and Imperial College.
Solar forcing of winter climate variability in the Northern Hemisphere by Sarah Ineson, Adam A. Scaife, Jeff R. Knight, James C. Manners, Nick J. Dunstone, Lesley J. Gray & Joanna D. Haigh Nature Geoscience (2011) doi:10.1038/ngeo1282
Sarah Ineson – Met Office Hadley Centre, FitzRoy Road, Exeter, Devon EX1 3PB, UK
Abstract:An influence of solar irradiance variations on Earth’s surface climate has been repeatedly suggested, based on correlations between solar variability and meteorological variables. Specifically, weaker westerly winds have been observed in winters with a less active sun, for example at the minimum phase of the 11-year sunspot cycle. With some possible exceptions, it has proved difficult for climate models to consistently reproduce this signal. Spectral Irradiance Monitor satellite measurements indicate that variations in solar ultraviolet irradiance may be larger than previously thought. Here we drive an ocean–atmosphere climate model with ultraviolet irradiance variations based on these observations. We find that the model responds to the solar minimum with patterns in surface pressure and temperature that resemble the negative phase of the North Atlantic or Arctic Oscillation, of similar magnitude to observations. In our model, the anomalies descend through the depth of the extratropical winter atmosphere. If the updated measurements of solar ultraviolet irradiance are correct, low solar activity, as observed during recent years, drives cold winters in northern Europe and the United States, and mild winters over southern Europe and Canada, with little direct change in globally averaged temperature. Given the quasiregularity of the 11-year solar cycle, our findings may help improve decadal climate predictions for highly populated extratropical regions.
A sceond paper in Nature Geoscience also released online yesterday reports that simulations with a climate model using new observations of solar variability suggest a substantial influence of the Sun on the winter climate in the Northern Hemisphere.
Atmospheric science: Solar cycle and climate predictions by Katja Matthes Nature Geoscience (2011) doi:10.1038/ngeo1298
Katja Matthes is at the Helmholtz Centre Potsdam, GFZ German Research Centre for Geosciences, Telegrafenberg, 14473 Potsdam, Germany
Interestingly a paper from 2001 with Michael Mann and Gavin Schmidt (of climategate infamy) as co-authors has similar findings:
Solar Forcing of Regional Climate Change During the Maunder Minimum by Drew T. Shindell, Gavin A. Schmidt, Michael E. Mann, David Rind and Anne Waple, Science 7 December 2001: Vol. 294 no. 5549 pp. 2149-2152 DOI: 10.1126/science.1064363
Abstract:We examine the climate response to solar irradiance changes between the late 17th-century Maunder Minimum and the late 18th century. Global average temperature changes are small (about 0.3° to 0.4°C) in both a climate model and empirical reconstructions. However, regional temperature changes are quite large. In the model, these occur primarily through a forced shift toward the low index state of the Arctic Oscillation/North Atlantic Oscillation as solar irradiance decreases. This leads to colder temperatures over the Northern Hemisphere continents, especially in winter (1° to 2°C), in agreement with historical records and proxy data for surface temperatures.
Update! The BBC reports on this story here but takes great care to pay due respect to global warming orthodoxy with the statement “The researchers emphasise there is no impact on global warming”.
Of course not – It’s only the sun stupid! And what can the sun possibly have to do with warming the planet?!
Related:
Colder winters to come and solar influence on climate beginning to get its due


