The fact that Arctic ice is growing may not be the good news that it seems to be. There are signs that the Earth is entering a very unpleasant cooling period. Sunspot activity remains very low.
“The sun has been very unusual for almost 15 years now,” Jens Pedersen, senior scientist at the Denmark’s Technical University, said.
Pedersen said the sun recently reached solar maximum and that there should be a lot of sunspot activity, but there isn’t.
“We have to go back 100 years to find a solar maximum that was as weak as the one we are in right now,” he told CBN News. “And the recent solar minimum…one has to go back 200 years to find one that was as weak.”
The last time the sun was this quiet, North America and Europe suffered through a weather event from the 1600s to the 1800s known as “Little Ice Age,” when the Thames River in London regularly froze solid, and North America saw terrible winters. Crops failed and people starved.
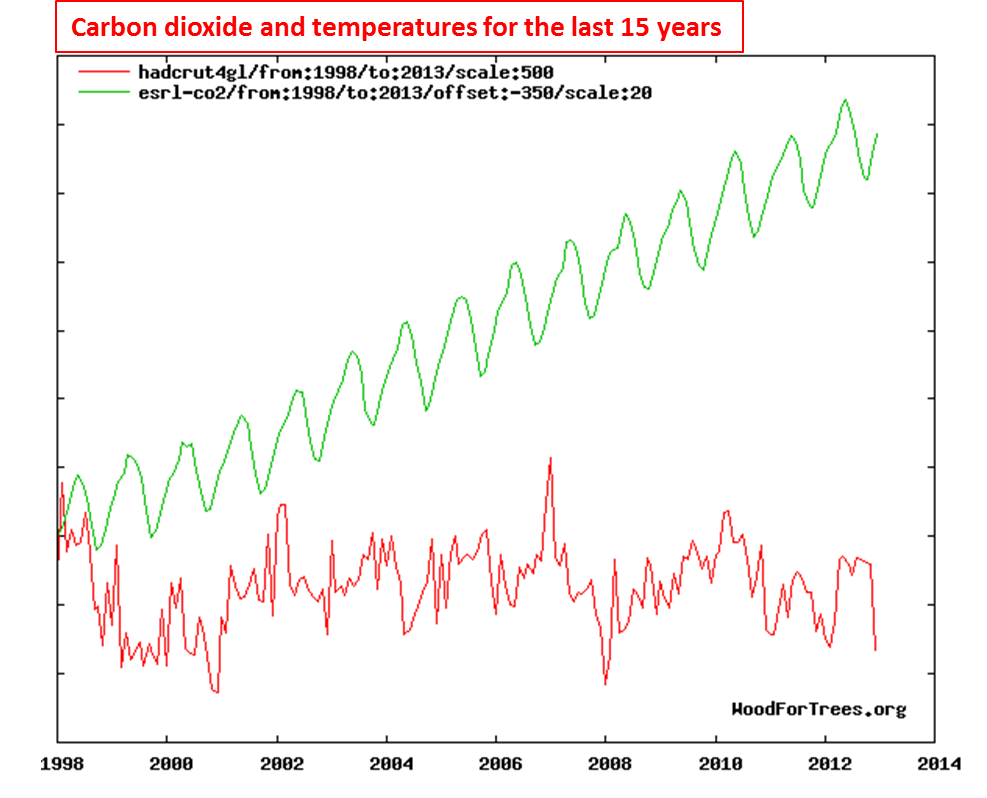
Pedersen said climate scientists know the Earth stopped warming 15 years ago. But the United Nations Intergovernmental Panel on Climate Change, of which Pedersen is an expert reviewer, suppressed a recent report from its own scientists that the U.N.’s climate model has been proven wrong.
“In particular one of the issues has been why global warming has stopped during the last 15 years, and climate scientists were very frank that the climate models do not match the climate we observe,” Pedersen said.
But politicians removed that embarrassing finding from the final draft. It’s as if the alleged danger from climate change can’t be wrong because it is now too important.
It has become a political movement, a cash cow for climate scientists and environmental groups, and a way for world leaders to control economies and people.
“It’s a political agenda,” Dan Gainor, vice president of business and culture at the Media Research Center, said. “When you look at what the government will be able to do with climate change, it gives them (access) into every aspect of our lives.” …..
I note that the global warming priesthood are busy contorting themselves to show that the current icy blast across the US is no proof that global warming has stopped and may even be proof that it is entirely due to global warming and ice melting in the Arctic!!! Every single US State – including Hawaii – recorded temperatures below freezing yesterday. Never mind that no climate model ever predicted record cold waves. The contortions can get quite amusing but it is a little frightening that “global warming ideology” has become the new catholicism of this age. (Note that Eric Holthaus was prepared to get a vasectomy for his faith and to save the world from global warming)
Ultimately reality must prevail – even when it conflicts with what computer models may say. This from The Guardian ( which is still smarting from the Ship of Fools fiasco).
Polar vortex – temperatures drop below freezing in all 50 US states
Temperatures in all 50 US states dipped below freezing on Tuesday in a rare nationwide chill that will keep a grip on much of the country for at least another day, with cutting winds and blizzards posing the most danger.
Florida, a state that normally basks in its reputation as a warm winter escape, experienced unusually low temperatures. In the midwest, northeast and eastern Canada, it was dangerous to venture outside. At some point on Tuesday, at least one location in each of the 50 US states recorded temperatures below freezing, with the highest point on Hawaii, Mauna Kea, recording a temperature of 21F (-6C).
The morphing of the science
Global warming >> Climate change >> Extreme Events >>>>>>>> Global Cooling
If it is not global warming it is global cooling or the ozone hole or population or food shortages or water shortages or energy shortages. It does not matter what is to cause the catastrophe. What is important to some people is to assert that a catastrophe – any catastrophe – will happen if we don’t do as they say.
Which is of course why anybody with any kind of a catastrophe scenario (including the IPCC) must be treated with the utmost suspicion and subjected to the most rigorous, inquisitorial scepticism possible.
While a silent majority of the scientific community may have been more skeptical, you ironically find one of the most outspoken supporters of modern day Al Gore style global warming alarmism was promoting global cooling in the 1970s, the late Dr. Steven Schneider;
and
From the BBC’s 1974 documentary, “The Weather Machine”; “The ice age is due now anytime“ – Professor George Kukla, Columbia University, 1974
In a few years we will be back to Ice Age Alarmism. Perhaps easily duped politicians will introduce incentives to consume more energy and hold back the advance of the ice-sheets!
Presumptions, presumptions everywhere but no evidence to be seen.
There is a presumption among the global warming orthodoxy – but no evidence – that increasing carbon dioxide concentrations in the atmosphere causes significant warming of the Earth’s surface.
There is a presumption that carbon dioxide emissions from human activities (primarily by the increase in fossil fuel combustion since the 1950’s) is the primary cause of the increase of concentration in the atmosphere. This presumption is based on the assumption that the oceans and the forests absorb just as much carbon dioxide as they emit. This balance is an assumption and is based on the argument that pre-industrial concentrations of carbon dioxide in the atmosphere were largely constant. The actual emissions from the forests and the oceans are each an order of magnitude greater than man-made emissions of carbon dioxide. The margin of error in the estimates of amounts of carbon dioxide emitted (and absorbed) by the oceans and the forests is greater than the emissions from fossil fuel combustion. The emissions due to volcanic activity are not well understood just as the rate at which carbonate sediments are laid down by the oceans is unknown (which in turn affects the concentration of what is dissolved in the oceans and therefore how much gets absorbed by the oceans from the atmosphere). Carbon dioxide released or absorbed by tectonic activity is unknown. There is a presumption based on some limited evidence that approximately 40% of what is released by fossil combustion is accumulating as atmospheric concentration. There is no presumption, however,that increasing carbon dioxide concentration in the atmosphere must lead to an increased absorption rate.
Fossil fuel combustion and man-made carbon dioxide emissions as well as the atmospheric concentration have been increasing at least since about 1950. For the last 17 years this increase has continued but global temperatures have not increased. For the last 10 years the global temperature has shown a slight decline. It is therefore presumed that the original presumption still holds and that the extra heat is presumed to be hidden in a variety of places (the deep oceans for example) other than at the Earth’s surface. There is no presumption that these observations are fundamentally in conflict with the original presumption.
It is entirely logical that warming of the earth will cause the ice caps to melt and sea levels to rise just as global cooling will cause the ice sheets to expand and the sea levels to fall. It is presumed by the “establishment” that observed short-term reductions of ice extent are not due to natural variation but are proof that man-made global warming prevails. But when ice extent increases – as is happening currently – it is presumed to be due to natural variability and not relevant to the underlying trend due to man-made global warming.
It is postulated by the establishment that extreme weather events are more likely to occur due to man-made global warming (and are not due to natural variability). But when extreme weather events show a decline – as they are doing currently – then any such decline is presumed to be due to natural variability.
A preponderance of “cold records” being broken – rather than “heat records” is presumed to be proof of man-made global warming causing extreme weather events.
Presumptions do not a science make – especially when the evidence available increasingly conflicts with the presumptions.
The de Vries solar cycle together with the AMO/PDO are sufficient to explain the main climate variations of the last 1000 years
It is unnecessary to invoke carbon dioxide and its effects to explain the climate cycles
The 21st century will see an underlying cooling due to the de Vries cycle and then modulated by the AMO/PDO.
The 200-210 year de Vries solar cycle (also known as the Suess cycle) has been postulated for some time (here and here for example) as being one of the main natural cycles governing our climate. The effect of the de Vries cycle can be traced back through the glacial record through many millenia and even through geologic ages. Many solar effects work on climate through ocean cycles. The Atlantic/Pacific Oscillations are well known as drivers of climate and can be traced back through at least about 1500 years. The Atlantic Multidecadal Oscillation (AMO) has a period of about 66 years while the Pacific Decadal Oscillation (PDO) has a slightly shorter cycle of 60 years.
The entire hypothesis that carbon dioxide concentrations in the atmosphere and therefore human emissions of carbon dioxide are responsible for “global warming” is based on the argument that nothing else can explain the warming witnessed during the 20th century. Yet this is not just conjecture it is a fantasy based on ignoring the effect of the natural cycles that are known to exist. In fact there is no need to invoke carbon dioxide concentration to explain the ups and down of climate. German researchers have now shown that just the de Vries Cycle together with the AMO and the PDO are quite sufficient. The period in the 1970’s and 1980’s often used as the foundation for “global warming” theory can be quite sufficiently explained by the AMO/PDO.
Just as we had about 100 years of an underlying warming due to the de Vries cycle in the 20th century, we are in for an underlying cooling through the 21st century in response to the de Vries solar cycle. This underlying trend will be modulated by the ups and downs of the AMO and the PDO. Carbon dioxide concentrations are largely irrelevant.
We reported recently about our spectral analysis work of European temperatures [1] which shows that during the last centuries all climate changes were caused by periodic (i.e. natural) processes. Non-periodic processes like a warming through the monotonic increase of CO2 in the atmosphere could cause at most 0.1° to 0.2° warming for a doubling of the CO2 content, as it is expected for 2100.
Fig. 1 (Fig. 6 of [1] ) shows the measured temperatures (blue) and the temperatures reconstructed using the 6 strongest frequency components (red) of the Fourier spectrum, indicating that the temperature history is determined by periodic processes only.
On sees from Fig. 1 that two cycles of periods 200+ years and ~65 years dominate the climate changes, the 200+ year cycle causing the largest part of the temperature increase since 1870.
Fig. 1: Construction of temperatures using the 6 strongest Fourier components (red), European temperatures from instrumental measurements (blue). It is apparent that only a 200+ year cycle and a ~65 year cycle play a significant role.
The ~65 year cycle is the well-known, much studied, and well understood “Atlantic/Pacific oscillation” (AMO/PDO). It can be traced back for 1400 years. The AMO/PDO has no external forcing it is “intrinsic dynamics”, an “oscillator”.
Although the spectral analysis of the historical instrumental temperature measurements [1] show a strong 200+ year period, it cannot be inferred with certainty from these measurements, since only 240 years of measurement data are available. However, the temperatures obtained from the Spannagel stalagmite show this periodicity as the strongest climate variation by far since about 1100 AD.
……….
Summary
The analysis of solar activity proves the existence and the strength of the 200+ year periodicity which we found from historical temperature measurements, as well as from the Spannagel stalagmite data. This 200+ year cycle is apparently the one known as “de Vries cycle”.
This solar “de Vries cycle together with the AMO/PDO determine practically completely the global climate of the past (Fig. 1) and the coming time. A significant influence of CO2 on the climate thus has to be excluded. This latter is not surprising in view of the small amount of CO2 in the atmosphere and its weak infrared absorption cross section (also in view of the various proves of NEGATIVE water feedback).
The present “stagnation” of global temperature (Fig. 5) is essentially due to the AMO/PDO: the solar de Vries cycle is presently at its maximum. Around this maximum it changes negligibly. The AMO/PDO is presently beyond its maximum, corresponding to the small decrease of global temperature. Its next minimum will be 2035. The temperature can expected to be then similar to the last AMO/PDO minimum of 1940. Due to the de Vries cycle, the global temperature will drop until 2100 to a value corresponding to the “little ice age” of 1870.
It accounts for the long temperature rise since 1870. One may note, that the stronger temperature increase from the 1970s to the 1990s, which is “officially” argued to prove warming by CO2, is essentially due to the AMO/PDO cycle.
[1] H.Luedecke, A. Hempelmann, C.O. Weiss; Clim. Past. 9 (2013) p 447
[2] F. Steinhilber, J. Beer; Journ. Geophys. Res.: Space Physics 118 (2013) p 1861
As Indonesia raised the warning level for the Mount Sinabung eruption it is worth noting that the last volcanic eruptions of 5 or greater on the Volcanic Explosivity Index (VEI) scale were the 1991 eruptions of Mount Pinatubo (VEI of 6) and Mount Hudson (VEI of 5).
The currently ongoing Mount Sinabung eruption (pictures here) gives cause for concern, as all Indonesian volcanoes do, but there is no certainty as to what intensity it may finally reach:
Jakarta Post:The volcanic ash spewed by Mount Sinabung in Karo regency, North Sumatra, disrupted a number of flights from Kuala Namu International Airport in Deli Serdang regency on Sunday. In Bandung, the Center for Volcanology and Geological Hazard Mitigation (PVMBG) increased the volcano’s status to “awas” (beware), the highest level of the four-level alert system.
During the 19th century VEI eruptions of 5 or greater ocurred every 11 years on average with the Krakatoa eruption being the greatest at VEI 6 in 1883. Through the 20th century, an eruption of intensity 5 or greater came at intervals varying from 1 year upto 23 years with an average interval of just under 7 years. The Novarupta (1912) and Mount Pinatubo (1991) eruptions were the two classified at VEI6.
1902 Santa Maria
1907 Kudach
1912 Novarupta
1913 Colima
1918 Katla
1932 Cerro Azul
1933 Kharimkotan
1956 Bezymianny
1963 Mount Agung
1980 Mount St. Helens
1982 El Chichón
1991 Mount Pinatubo
1991 Mount Hudson
So far in this century the 2010 Eyjafjallajökull eruption in Iceland “only” reached a VEI intensity of 4. The 2012 Mt. Etna eruption was rated a 3+.
The last VEI 5 level eruption was in 1991 and a major eruption of intensity 5 or greater is now overdue. The interval of 22 years is almost as long as the longest interval between major eruptions in the 20th century. Of course even VEI 6 is still a great deal less than the VEI 8 of Toba or Yellowstone.
The VEI is an index taking both the volume of tephra ejected as well as the height to which it is ejected into account. While there is no evidence that the impact of volcanic eruptions is more than a temporary perturbation of the underlying climate cycle, these perturbations may well last a year or two. The effect on climate is usually that of cooling.
The most significant climate impacts from volcanic injections into the stratosphere come from the conversion of sulfur dioxide to sulfuric acid, which condenses rapidly in the stratosphere to form fine sulfate aerosols. The aerosols increase the reflection of radiation from the Sun back into space, cooling the Earth’s lower atmosphere or troposphere. Several eruptions during the past century have caused a decline in the average temperature at the Earth’s surface of up to half a degree (Fahrenheit scale) for periods of one to three years. The climactic eruption of Mount Pinatubo on June 15, 1991, was one of the largest eruptions of the twentieth century and injected a 20-million ton (metric scale) sulfur dioxide cloud into the stratosphere at an altitude of more than 20 miles. The Pinatubo cloud was the largest sulfur dioxide cloud ever observed in the stratosphere since the beginning of such observations by satellites in 1978. It caused what is believed to be the largest aerosol disturbance of the stratosphere in the twentieth century, though probably smaller than the disturbances from eruptions of Krakatau in 1883 and Tambora in 1815.
But an eruption of VEI 5 or greater within the next year or two could well accelerate the underlying global cooling cycle that may be underway (and caused primarily by solar effects – direct and indirect).
The diagram below comes from a guest post by Dan Pangburn at The Hockey Schtick.
Global temperature anomaly and major volcanic eruptions
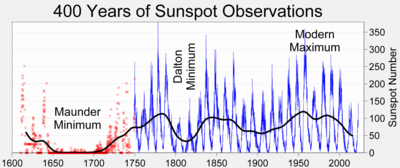
I have been of the opinion for some time now thatthe current Landscheidt Minimum that we are in has a reasonable probability of reaching Dalton Minimum conditions and even developing into a Maunder-like minimum. The Landscheidt Minimum has yet to be officially named. It seems increasingly probable that we are in for some 20 – 30 years of global cooling. This has not been the view of the global warming enthusiasts who don’t much believe in the Sun. But now some heavy-weight opinions are also giving more credence to the possibility of a Maunder-like Minimum. We have currently reached solar maximum in Solar Cycle 24 and SC24 and the coming SC25 are comparable to SC’s 4,5 and 6 which corresponded with the Dalton Minimum. Note that the numbering system for Solar Cycles only starts after the Maunder Minimum.
It’s known by climatologists as the ‘Little Ice Age’, a period in the 1600s when harsh winters across the UK and Europe were often severe. The severe cold went hand in hand with an exceptionally inactive sun, and was called the Maunder solar minimum.
Now a leading scientist from Reading University has told me that the current rate of decline in solar activity is such that there’s a real risk of seeing a return of such conditions. I’ve been to see Professor Mike Lockwood to take a look at the work he has been conducting into the possible link between solar activity and climate patterns.
According to Professor Lockwood the late 20th century was a period when the sun was unusually active and a so called ‘grand maximum’ occurred around 1985. Since then the sun has been getting quieter. By looking back at certain isotopes in ice cores, he has been able to determine how active the sun has been over thousands of years.
Following analysis of the data, Professor Lockwood believes solar activity is now falling more rapidly than at any time in the last 10,000 years. He found 24 different occasions in the last 10,000 years when the sun was in exactly the same state as it is now – and the present decline is faster than any of those 24. Based on his findings he’s raised the risk of a new Maunder minimum from less than 10% just a few years ago to 25-30%. And a repeat of the Dalton solar minimum which occurred in the early 1800s, which also had its fair share of cold winters and poor summers, is, according to him, ‘more likely than not’ to happen. He believes that we are already beginning to see a change in our climate – witness the colder winters and poor summers of recent years – and that over the next few decades there could be a slide to a new Maunder minimum.
It’s worth stressing that not every winter would be severe; nor would every summer be poor. But harsh winters and unsettled summers would become more frequent.
Professor Lockwood doesn’t hold back in his description of the potential impacts such a scenario would have in the UK. He says such a change to our climate could have profound implications for energy policy and our transport infrastructure. Although the biggest impact of such solar driven change would be regional, like here in the UK and across Europe, there would be global implications too. ………
Recent solar activity (Wikipedia) showing the Maunder and Dalton minima
According to the NSIDC – which is an important part of orthodox officialdom – 2013 was a better year for the cryosphere since:
“This summer, Arctic sea ice loss was held in check by relatively cool and stormy conditions. As a result, 2013 saw substantially more ice at summer’s end, compared to last year’s record low extent. The Greenland Ice Sheet also showed less extensive surface melt than in 2012. Meanwhile, in the Antarctic, sea ice reached the highest extent recorded in the satellite record”.
What makes for “good” or “bad” depends upon what the fears are. If global warming is the fear then – as the NSIDC states – it was a good year. But if a cooling cycle or even a coming ice age is the fear then the increasing ice extent, the short summer, the extended winter last year and the increased snow cover in the Northern Hemisphere are all just early warning signs of what is to come.
We don’t know if we are in:
a run-away global warming period (as the global warming orthodoxy will have us believe), or
a series of global warming and cooling cycles, each about 20 – 30 years long and responding to the decadal ocean cycles, or
The global warming pause of the last 17 – 18 years suggests that “run-away” global warming is unlikely. The slight decrease in global temperatures over the last 7 – 8 years is not conclusive but is also evidence that the effect of increasing carbon dioxide on global temperature is far from certain. Even if it exists it is very small and is clearly not yet properly understood. Catastrophe scenarios may attract funding but reduce the credibility of the doom-sayers.
If we are just in a regular cooling cycle then the increasing ice level is nothing to be afraid of. Even if 2 or 3 decades of cooling give us another Little Ice Age, it will be followed by a warming cycle. It will not necessarily mean the start of the end of the current interglacial. But it will mean 20 – 30 years of cooling and the increased use of fossil fuels will be required. Fracking and methane hydrate recovery from the deep sea will be needed along with the continued – and increased – mining of coal. Wind and solar energy can play their little part in the niches that they are suitable for. Nuclear energy will have to make a come-back.
But if the Earth is now responding – by mechanisms unknown – to the Milankovitch cycles – and has started its many thousands year journey into glacial conditions, then we would be well served by developing the strategies and technologies for prospering in such times. We will gradually lose habitat in the North to growing ice sheets but we will gain new habitat as the sea level sinks. But these changes will take place over many generations (50 – 100) and we will have time to adapt. One lost generation – as the last 20 years of global warming hysteria will be – will be of little consequence. Humans have lived and prospered through glacial conditions before and will again. One big difference will be the availability of affordable and abundant energy which gives us the ability – not to stop the advance of the ice sheets – but to be able to continue to access resources and minerals under the ice sheets. We may even have colonies living on top of the shallower ice sheets. But there will also be new opportunities. The increase of habitat as the sea levels drop (by upto 150m) will be in exceptionally fertile areas for food production. Mineral and energy resources currently under the sea will become even more accessible. As with the last glacial period it will probably be a period in which human ingenuity is challenged and innovation will flourish.
The coming of a new glacial period will be no catastrophic change. We will have plenty of time to adapt. And in the 1,000 or 2,000 years it will take to establish glacial conditions, humans will probably have found new frontiers and established new colonies in space. And in 50 or 100 generation humans will continue to evolve. The humans coming out of the next glacial will not be quite like us.
It is quite wrong to think of the IPCC as some august body looking objectively at Climate Change and what causes climate to change. They only operate as a PR agent – under the cloak of consensus science – for the Global warming hypothesis. Global cooling hypotheses or – in fact – any hypotheses other than carbon dioxide being the controller of global temperature are given short shrift. Even real observations and all global cooling trends are ignored. Global warming models take precedence over real data. The Sun is ignored. Climate sensitivities is apparently too new a topic to be considered.
They do not just cherry pick data; they just ignore it when they represent inconvenient truths. The last 17 years with no global warming are merely dismissed as being for too short a period. But then the IPCC has only been in operation for 25 years. The IPCC has not looked up from its computer models to realise that for most of its life it has seen no global warming.
If the IPCC was really looking at climate change and not just promoting the idea of global warming they might have shown some interest in the climate trend-break which seems to have occurred about 15 years ago. But a trend-break would be heretical. Their dismissal yesterday of the last 15 – 18 years was disgraceful. How, after such real observations, they are more certain than ever that global warming continues and that carbon dioxide is the culprit, is not rational and can only be “wishful thinking” (to put the best interpretation on it).
(data below generated using woodfortrees interactive database)
Global temperatures since 1850
And how their certainty about carbon dioxide being the prime culprit can be increased with the reality of temperatures declining in the last 15 or so years boggles rationality. Except of course that their certainty is based on climate models and cannot be bothered by real observations.
A new paper shows that for the last 30 years Antarctic ice is increasing and correlates best with a cooling global temperature.
Qi Shu, Fangli Qiao, Zhenya Song and Chunzai Wang, Sea ice trends in the Antarctic and their relationship to surface air temperature during 1979–2009, Clim Dyn (2012) 38:2355–2363, DOI 10.1007/s00382-011-1143-9
Abstract: Surface air temperature (SAT) from four reanalysis/analysis datasets are analyzed and compared with the observed SAT from 11 stations in the Antarctic. It is found that the SAT variation from Goddard Institute for Space Studies (GISS) is the best to represent the observed SAT. Then we use the sea ice concentration (SIC) data from satellite measurements, the SAT data from the GISS dataset and station observations to examine the trends and variations of sea ice and SAT in the Antarctic during 1979–2009. The Antarctic sea ice extent (SIE) shows an increased trend during 1979–2009, with a trend rate of 1.36 ± 0.43% per decade. Ensemble empirical mode decomposition analysis shows that the rate of the increased trend has been accelerating in the past decade. Antarctic SIE trend depends on the season, with the maximum increase occurring in autumn. If the relationship between SIC and GISS SAT trends is examined regionally, Antarctic SIC trends agree well with the local SAT trends in the most Antarctic regions. That is, Antarctic SIC and SAT show an inverse relationship: a cooling (warming) SAT trend is associated with an upward (downward) SIC trend.
The variations of local SIC and SAT anomalies in autumn during the past 30 years
Summary: ….
The SAT and SIC trends illustrate an inverse relationship in most of the Antarctic regions, especially in summer and autumn. This indicates that a cooling (warming) SAT trend is associated with an upward (downward) SIC trend in the Antarctic. The station observations also confirm the inverse relationship between SAT and SIC. In most of the Antarctic regions, a cooling trend of SAT in summer and autumn is associated with an increased trend of SIC. …
Our analyses show that the relationship between sea ice and SAT trends should be examined regionally rather than integrally.