Madras Day: 22nd August 1639 – 2014
Madras Day was celebrated yesterday as the 375th anniversary of the founding of the city now known as Chennai on the Coromandel coast.
Andrew Cogan and Francis Day’s factory site on an uninhabited sandy strip eventually grew to become one of India’s renowned metropolises, and the capital city of Tamil Nadu. Every year, August 22 is celebrated as Madras Day, and this year, 2014, is Chennai’s 375 birthday.
Excerpt from Edward Lear’s The Courtship of the Yonghi-Bonghi-Bo (this should be read in its entirety and only be read aloud)
On the Coast of Coromandel
Where the early pumpkins blow,
In the middle of the woods
Lived the Yonghy-Bonghy-Bo.
………….
“On this Coast of Coromandel
Shrimps and watercresses grow,
Prawns are plentiful and cheap,”
Said the Yonghy-Bonghy-Bo.
“You shall have my chairs and candle,
And my jug without a handle!
Gaze upon the rolling deep
(Fish is plentiful and cheap);
As the sea, my love is deep!”
Said the Yonghy-Bonghy-Bo,
Said the Yonghy-Bonghy-Bo.
……….
“Lady Jingly! Lady Jingly!
Sitting where the pumpkins grow,
Will you come and be my wife?”
Said the Yonghy-Bònghy-Bò.
……….
Down the slippery slopes of Myrtle,
Where the early pumpkins blow,
To the calm and silent sea
Fled the Yonghy-Bonghy-Bo.
………
From the Coast of Coromandel
Did that Lady never go;
On that heap of stones she mourns
For the Yonghy-Bonghy-Bo.
………

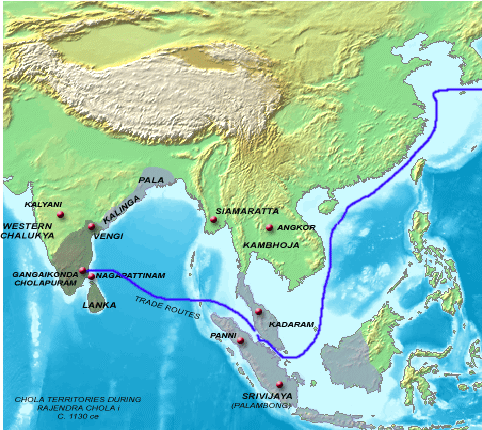
Chola trade under Rajendra Chola c. 1130 Wikimedia
The earliest known settlements in South India date back to more than 2 million years ago in the form of Acheulian stone tools (Lower Paleolithic from about 2.6 million to 300,000 years ago). The oldest human remains (probably homo erectus or archaic homo sapiens) found is a fossilised infant skull from about 200,000 years ago. The unfortunate and love-sick Yonghi-Bonghi-Bo was never destined to win his Lady Jingly Jones but the Coromandel coast has seen a continuous settlement of humans for over 2 million years. Homo sapiens probably came in two waves; one before the Toba eruption of 74,000 years ago and another perhaps around 50,000 years ago. The Toba eruption was possibly the greatest catastrophe ever visited on humans on that coast. In due course, hunter-gatherers gave way to farmers and the evidence shows that the Neolithic was long established by around 2,600 BCE (4,700 years ago). The early Chola-dynasty rule was established by 100 CE in the Sangam era. They lost power to the Pallavas around 300 CE who in turn were replaced by Pandyas around 600 CE but then the Cholas returned around 900 CE. Whether these medieveal Cholas were truly descendants of the early Cholas is uncertain but they certainly claimed to be. By 1,000 years ago at the height of the Chola Empire, their territories extended well into South-east Asia. Chola traders were finding their way up to today’s Korea, protected by a Navy which even had some blue-water capabilities. The later Cholas were again replaced by the Pandyas in 1279 but the rule of the great Tamil dynasties came to an end with the establishment of the short-lived Madurai Sultanate in 1335 and its many subsequent successors. Then came the colonists. The Portuguese, the Dutch, the British, the Danes and the French. The Portuguese were first. The “realm of the Cholas” in Tamil was “Cholamandalam” and from this came the Portuguese corruption to “C(h)oro-mandel”. Vasco da Gama reached the Western Indian Malabar coast on 20th May 1498. In 1522 they established São Tomé de Meliapore named after St. Thomas who was supposed to have preached at St. Thomas’ Mount between 52 and 70 CE. The legend is that St. Thomas died here and by 1523, the Portuguese had built a shrine there. “By late 1530 the Coromandel Coast was home to three Portuguese settlements at Nagapattinam, São Tomé de Meliapore, and Pulicat”. The Dutch reached the Coromandel Coast by 1606 and built their Geldria Fort near Pulicat (where the Portuguese were already present) as a staging post to the East Indies. The first British trading post was established in 1610 at Masulipatnam which had been abandoned by the Portuguese. The Danes reached in 1620 in Tranquebar and established a protestant mission. The French were late out and their first permanent colony was not established till they purchased Pondicherry in 1673.
By 1825, the Dutch had lost the last of their trading posts in India. The Danes left Tranquebar in 1845. The British left with Independence in 1947. By 1954 the French had ceded all colonies in India (though not ratified by the French Parliament till 1962). The Portuguese lost all footholds on the Coromandel coast by 1749 and were finally pushed out of India by military action in 1961.
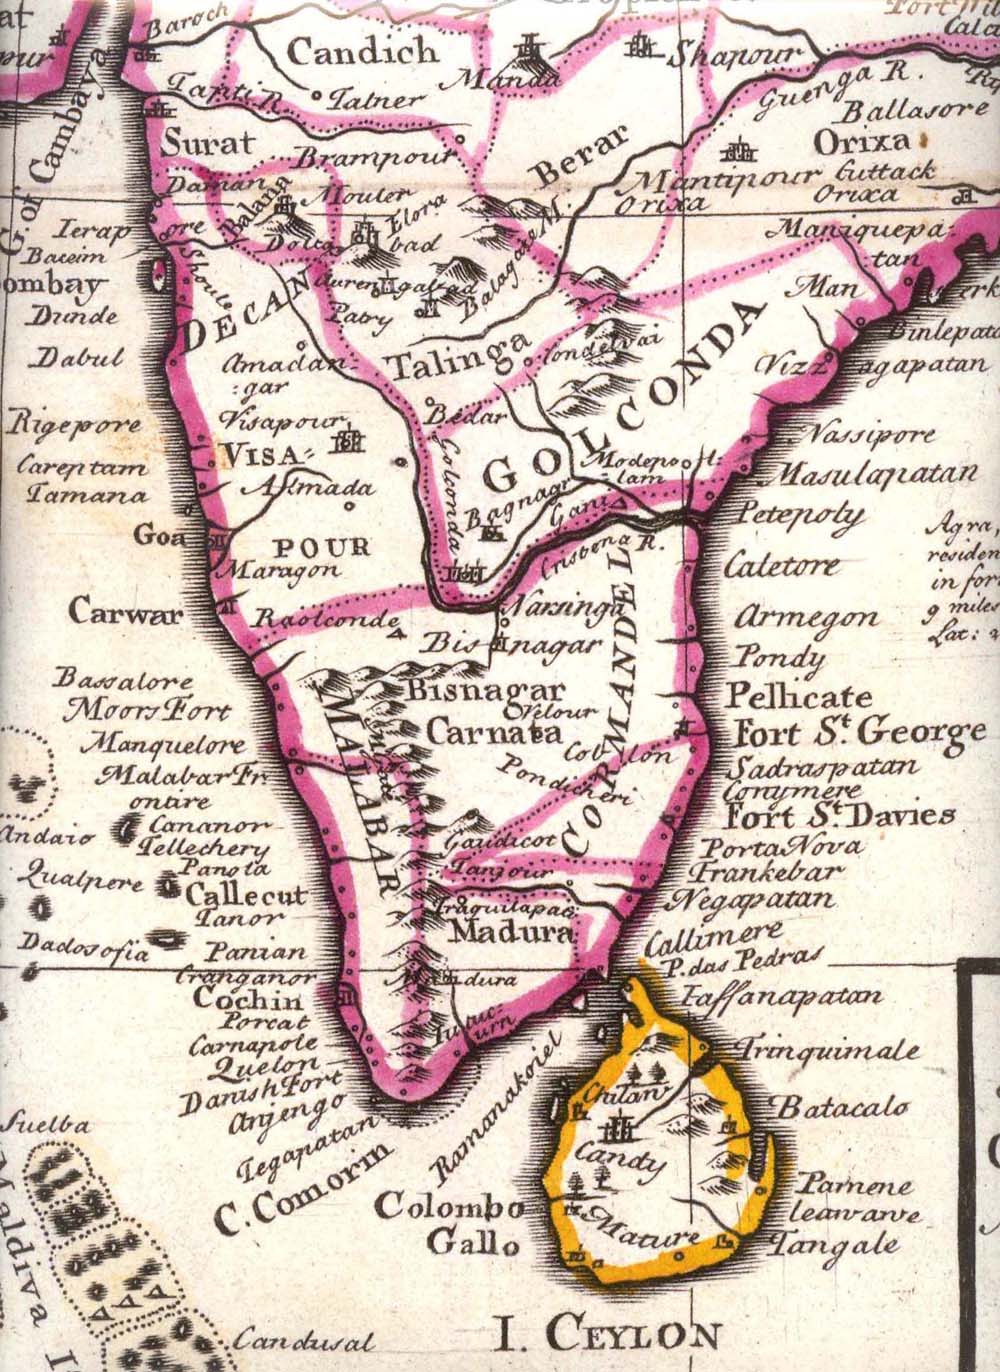
The Coromandel coast 1715

coromandel coast 1715 by moll
The British East India Company was quite desperate to find a foothold on the Coromandel coast but their efforts at Pulicat were defeated by the Dutch. They tried at to settle at Peddapalli and Nizampatnam but were laid low by the climate and by disease. The English, after some effort, secured the privilege of building a factory at Masulipatam port.
The Beginnings:
But they later abandoned their factory and crept away in a small boat to Durgarazpatnam (otherwise known as Armagaon) situated about 35 miles to the north of Pulicat. This place was a miserable port and was too poor to supply the calico cloth which the English wanted for export to Europe. But it was the only safe shelter for the English at the time and here they built a small fort and mounted a few pieces of cannon upon it. But trade did not thrive and the miserable English traders planned to go back to Masulipatam under the protection of a Golden Firman which the Sultan of Golconda was kind enough to give them. But Masulipatam was in the throes of a famine just then …..
With Masulipatam unprosperous and Armagaon hopeless, the English traders anxiously looked out for a new site that would be more propitious for them. Mr. Francis Day, the future founder of Madras, who was then a Member of the Masulipatam Council and the Chief of the Armagaon Factory, made a voyage of exploration in 1637 down the coast as far as Pondicherry with a view to choose a site for a new settlement.
Damarla Venkatapathy Nayak ruled all the coast country from Pulicat to the Portuguese settlement of San Thome now included within the City of Madras. He had his head-quarters at Wandiwash and his brother Ayyappa Nayak resided at Poonamallee, a few miles to the west of Madras, and looked after the affairs of the coast.
And so it was in August 1639 that Francis Day and Andrew Cogan on behalf of the East India Company purchased a 2 year grant from the Nayak for the village of Madraspattnam and with permission to build a fort and a factory. That became Fort St. George with the village of Madraspattnam just to the south and a village – called Chennaipattnam by the locals – to the north.
And the rest is history.
Day and Cogan are commemorated nowhere — except by Madras Day on 22nd August every year. But what is not really known is how the village of Madraspattnam, which clearly existed before Day and Cogan turned up, got its name. In one story it was named after a Christian fisherman named Madresan and in another after a Muslim madrassa in the vicinity. Another story speculates that it was because of the nearby Madre de Dios Church built by the Portuguese in São Tomé de Meliapore. But the story I like best is that it comes from the name of the wealthiest Portuguese family of the time in São Tomé de Meliapore – the Madeiros.
And that is the tale of Chennai on the Coromandel coast which once went by the name of a Portuguese family, where prawns are still plentiful and cheap and where the Yonghy-Bonghy-Bo broke his heart over the Lady Jingly Jones.