Archive for the ‘Natural Phenomena’ Category

Cyclone Phailin will test Indian preparedness

October 12, 2013

UPDATE!

Saturday 12th, 6:30pm Indian Standard Time: Landfall is expected at any time now. So far some 600,000 people have been evacuated or have moved out of harms way. It has been the largest evacuation in India for 23 years.

______

The Bay of Bengal is no stranger to severe weather and severe cyclonic storms occur almost annually. However super cyclones (corresponding to an Atlantic Category 5 Hurricane) occur every 10 -20 years. Fatalities (direct and indirect by subsequent disease) have been huge in this heavily populated area. Super cyclones are defined as having wind speeds in excess of 220km/h and the current Cyclone Phailin is on the edge of that level with winds currently at about 210km/h. The Indian Meteorological Depratment expects the wind speeds to stay at the 210-220 km/h level.

ToI: Foreign agencies claimed Indian authorities are underestimating Phailin, quoting London-based Tropical Storm and US Navy’s joint typhoon warning centre as forecasting winds up to 315 kmph. Indian agencies, however, said wind speeds are much lower.

Super or Severe Cyclone Phailin is expected to make landfall this evening (about 6pm local time Saturday 12th October) somewhere along the Odisha coast. Warnings have been issued and about 200,000 have been asked to evacuate their coastal homes. Relief personnel and police are on alert. The Army has been deployed in some areas. Some 200 tourists have been assisted to leave the area and tourist bookings have been cancelled for upto a week.

Large improvements in the early warning and relief infrastructure have taken place since the catastrophic death toll in the super cyclone of November 1970. But Cyclone Phailin could be the biggest test for Indian preparedness since 1999.

Major super cyclones the region have been:

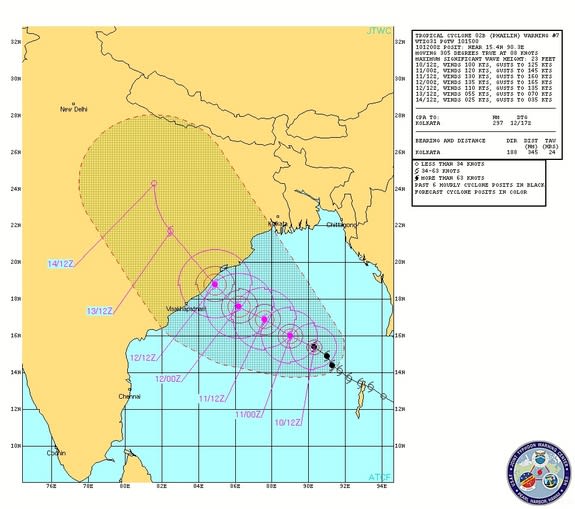
The projected path of Tropical Cyclone Phailin towards India as of 11:30 a.m. ET on Oct. 10, 2013.

Yahoo News: Experts say that the enormous and powerful storm, with maximum sustained winds of more than 160 mph (260 km/h), will bring a “catastrophic” storm surge, the water that a storm’s winds push in front of it and that inundate a coastline as the storm makes landfall, said Hal Needham, a climatologist at Louisiana State University. The storm surge is expected to reach heights of 20 feet (6 meters), Needham told LiveScience. The storm is likely to be “as bad or worse” than a cyclone that followed a similar trajectory in 1999, called Odisha cyclone for the area it hit.

Times of India: Touching wind speeds of 210-220 km an hour, Cyclone Phailin is set to hit the Odisha coast between Paradip and Kalingapatnam with full fury on Saturday evening, whipping up a storm surge up to 10 feet above the tide level posing a threat to low-lying villages.

Anticipating the cyclone’s fury, the state government began Odisha’s biggest ever evacuation of shifting more than three lakh (300,000) people out of harm’s way as chief minister Naveen Patnaik promised there would be zero casualties. The evacuation is expected to be complete by Saturday morning.

Met sources said the cyclone’s exact landfall is likely to be around the popular beach destination of Gopalpur and coastal Odisha as well as inland areas are expected to receive heavy rainfall likely to last till Sunday.

Although the Met is not categorizing Phailin as a “super cyclone” as it is yet to cross the 220 kmph barrier, there is little doubt that Odisha was bracing for a battering with the storm reported just 400 km south east of Gopalpur at 9pm on Friday. ….

….. Ganjam district is likely to be worst-hit. Other coastal districts falling within 75 km radius of the eye of the storm would also be impacted. “The exact landfall destination of the cyclone can be known once it comes nearly 200 km from the coast. Phailin’s movement however indicates that the situation would not be like the 1999 super cyclone during which the storm lay stationery over the coastal areas for nearly 24 hours and caused a sea surge of about 30 ft. This time 10 ft high wave is expected. More so, the expected landfall area being hilly, the impact of the cyclone would be less and weaken quickly,” IMD Bhubaneswar centre director Sarat Sahu said.

Not leaving anything to chance, the state government began evacuating people from coastal districts of Ganjam, Khurda, Puri, Jagatsinghpur and Kendrapada. Those who refused to leave their homes were forcibly taken to safer places. “There are 247 cyclone shelters and 10,000 concrete schools identified to house the villagers. We want to complete the evacuation by Saturday morning, particularly in Ganjam district which is likely to bear the brunt of the cyclone,” special relief commissioner P K Mohapatra said.

The central government has dispatched 10 helicopters, four Cheetah helicopters and two MI-17 and AN-32 planes to help the state government in rescue and relief operations. The government’s measures notwithstanding, thousands of people from the coastal region were rushing to railway stations and bus stops to escape the cyclone.

Arctic ice past minimum and growing fast and Antarctic ice reaching maximum at record level

October 5, 2013

Arctic ice extent reached its minimum about 2 weeks ago and is now growing fast.

Arctic Ice extent 20131005

Arctic Ice extent 20131005 source: COI

At the Antarctic however, the sea ice extent is just about reaching its maximum level which is at a record level.

Antarctic sea ice extent 20131004

Antarctic sea ice extent 20131004 source: cryosphere


Images of new island born after earthquake in Pakistan

September 28, 2013

A second earthquake (6.8 magnitude) rocked south-west Pakistan today, in a region where at least 400 people died in a 7.7 magnitude quake earlier this week. The earlier quake gave birth to a new island off the coast of Gwadar.

Map locator

The epicentre of Tuesday’s quake, which hit close to the location of the latest seismic shock. BBC

From NASA’s Earth Observatory:

On September 24, 2013, a major strike-slip earthquake rattled western Pakistan, killing at least 350 people and leaving more than 100,000 homeless. The 7.7 magnitude quake struck the Baluchistan province of northwestern Pakistan. Amidst the destruction, a new island was created offshore in the Paddi Zirr (West Bay) near Gwadar, Pakistan.

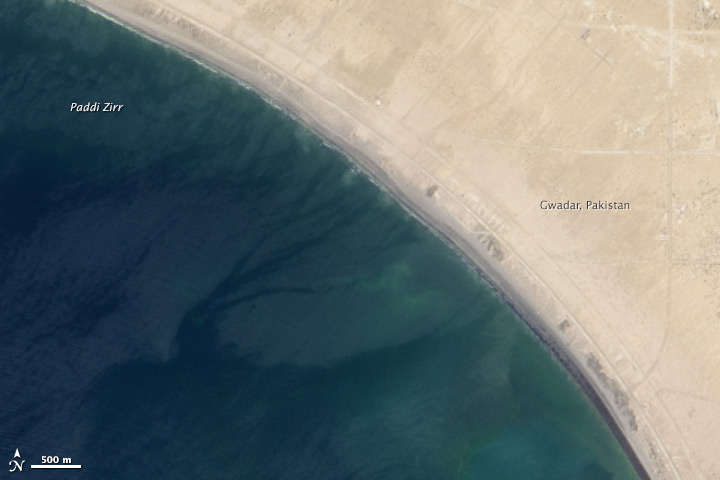
On September 26, 2013, the Advanced Land Imager (ALI) on NASA’s Earth Observing-1 (EO-1) satellite captured the top image of that new island, which sits roughly one kilometer (0.6 miles) offshore. Likely a mud volcano, the island rose from the seafloor near Gwadar on September 24, shortly after the earthquake struck about 380 kilometers (230 miles) inland. The lower image, acquired by the Operational Land Imager on the Landsat 8 satellite, shows the same area on April 17, 2013.

Earthquake Births New Island off Pakistan

acquired September 26, 2013 – Earthquake Births New Island off Pakistan

Coast of Gwadar acquired April 17, 2013

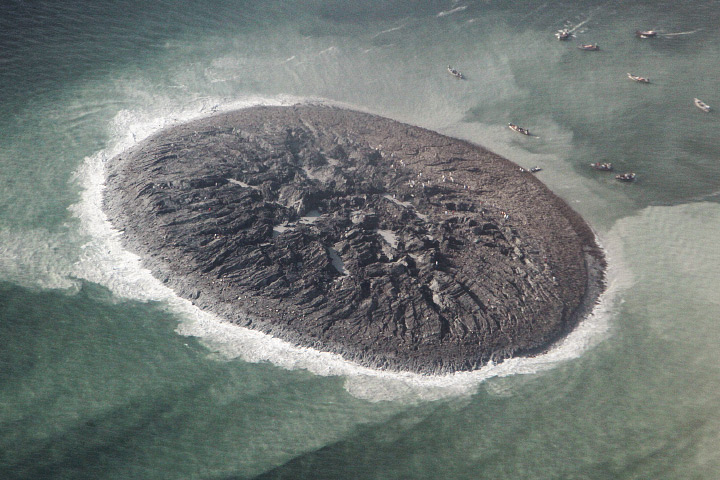
The aerial photograph below from the National Institute of Oceanography provides a close-up of the landform, estimated to stretch 75 to 90 meters (250 to 300 feet) across and standing 15 to 20 meters (60 to 70 feet) above the water line. The surface is a mixture of mud, fine sand, and solid rock.

Aerial view of new island acquired September 26, 2013

“The island is really just a big pile of mud from the seafloor that got pushed up,” said Bill Barnhart, a geologist at the U.S. Geological Survey who studies earthquakes in Pakistan and Iran. “This area of the world seems to see so many of these features because the geology is correct for their formation. You need a shallow, buried layer of pressurized gas—methane, carbon dioxide, or something else—and fluids. When that layer becomes disturbed by seismic waves (like an earthquake), the gases and fluids become buoyant and rush to the surface, bringing the rock and mud with them.”

Inam asserted that the underground pressure in this case came from expanding natural gas. “The main driving force for the emergence of islands in this part of the world is highly pressurized methane gas, or gas hydrate. On the new island, there is a continuous escape of the highly flammable methane gas through a number of vents.”

Several of these islands have appeared off the 700-kilometer-long Makran coast in the past century noted Eric Fielding, a tectonics scientist at NASA’s Jet Propulsion Laboratory. He explained that the Makran coast is where the Arabian tectonic plate is pushed northward and downward to go underneath the Eurasian continental plate. The thick layer of mud and rock on the Arabian Plate is scraped off and has formed the land in southwestern Pakistan, southeastern Iran, and the shallow underwater area offshore.

“The Makran coast is not very populated and any such event may easily go unnoticed, so satellite images are extremely important,” Inam said. “Mud volcanoes and islands are a natural hazard and threat to navigation.”

The life of this island is likely to be short. That underground pocket of gas will cool, compress, or escape over time, allowing the crust to collapse and settle back down. Waves, storms, and tidal action from the Arabian Sea will also wash away the loose sand, soft clay, and mud. Barnhart says such islands usually last a few months to a year before sinking back below the water line.

Great Tohoku quake in 2011 caused standing waves in Norwegian fjords 30 minutes later

August 13, 2013

Seismic seiches are standing waves set up on rivers, reservoirs, ponds, and lakes when seismic waves from an earthquake pass through the area. They are in direct contrast to tsunamis which are giant sea waves created by the sudden uplift of the sea floor.”

A new paper describes how these seiches -standing waves – observed in the Norwegian fjords in 2011 – for the first time since the 1950’s – have been linked to the Great Tohoku Quake of 2011 half an hour earlier.

Stein BondevikBjørn Gjevik and Mathilde B. Sørensen, Norwegian seiches from the giant 2011 Tohoku earthquake, Geophysical Research Letters, DOI: 10.1002/grl.50639, 2013

Abstract: Seismic waves of the giant 2011 Tohoku earthquake triggered seiches in western Norwegian fjords. The seiching began a half hour after the earthquake origin time. The oscillations were noted by eyewitnesses and recorded by surveillance and cell phone cameras. The observations show maximum trough-to-peak amplitudes of 1.0–1.5 m and periods of 67–100 s. The water waves were not triggered from the arrival of the surface waves, the timing inferred for other seiches. Instead, the seiching began during the passage of horizontal waves. We reproduced the S wave trigger by means of a shallow-water wave model calibrated previously to Norwegian tides and storm surges. The simulations, which used the observed earthquake motion as forcing, show water waves with periods and amplitudes similar to those in the film clips. However, the strongest horizontal ground oscillations with shorter periods (20–30 s) did not contribute much to the formation of the seiches.

It is not the first time that such standing waves have been observed so far away. As the US Geological Service notes:

The term seismic seiche was first coined by Anders Kvale in 1955 to describe oscillation of lake levels in Norway and England caused by the Assam earthquake of August, 1950. But this was not the first time that seismic seiches had been observed. The first published mention was after the great earthquake of November 1755 at Lisbon, Portugal. An article in Scot’s Magazine in 1755 described seiches in Scotland in Loch Lomond, Loch Long, Loch Katrine and Loch Ness. They were also seen in English harbors and ponds and were originally described in the Proceedings of the Royal Society in 1755.

…….

Seismic waves from the Alaska earthquake of 28 March, 1964, were so powerful that they caused water bodies to oscillate at many places in North America. Seiches were recorded at hundreds of surface-water gaging stations – although they had rarely been reported following previous earthquakes. Indeed, four seiches were observed in Australia.

Some of the 1964 seiches were very large. Waves as high as 1.8 meters were reported on the Gulf Coast – probably because they were generated in resonance with the seismic surface waves.

In the case of the Norwegian fjords and the Great Tohoku quake, PhysOrg reports:

The scene was captured by security cameras and by people with cell phones, reported to local media, and investigated by a local newspaper. Drawing on this footage, and using a computational model and observations from a nearby seismic station, Bondevik et al. identify the cause of the waves—the powerful magnitude 9.0 Tohoku earthquake that hit off the coast of Japan half an hour earlier.

In closed or semi-enclosed bodies of water, seismic waves can trigger standing waves known as “seiches.” Seiching had not been recorded in Norway’s fjords since 1950. Scientists have traditionally thought that seiching is caused by seismic surface waves, but the authors find that the fjord seiching was initiated before the surface waves had arrived.

Using seismic observations and a model for local fjord behavior, they find that in this case the seiching was triggered by S waves, which travel through Earth’s body, and later was amplified by Love waves, which travel on Earth’s surface. There are a lot of open questions surrounding the connection between earthquakes and seiching, but the authors’ research supports the idea that not all earthquakes will cause seiching in all enclosed bodies of water. The occurrence of the Japanese earthquake?induced seiches depended on the period and orientation of the seismic waves aligning with the natural frequency and orientation of the body of water.

Could solar flare last week be linked to two major earthquakes yesterday?

April 17, 2013

Like primitive man I am overwhelmed by the power of the Sun and a firm believer that even minute solar effects can have a major effect on the Earth and its systems. (I also note that my deification of the Sun must be similar to that by our ancient ancestors and is probably not unconnected to my moving to Scandinavia). In any case I am convinced that for climate

“Solar effects are much more profound than many so-called climate scientists like to admit”,

but I am not sure how strong the link to earthquakes is.

The link between solar effects (radio flux, sunspots, magnetic reversals, proton events….) and volcano activity and earthquakes has been postulated and studied many times but if any such link does exist it is not something obvious and it is by unknown mechanisms. For some this search for such a link is not “science” and there is no link. For others it can be a lifetime’s quest. But “intuition” and “gut-feeling” keeps me believing that there must be a connection. It could well be that the build-up of stresses upto some “breaking point” within the earths crust are a result of ongoing geologic processes and do not need any external trigger like solar activity or the position of the planets to be unleashed. But even continental drift and the build-up of seismic or volcanic stresses are all – ultimately – driven by energy fluxes. And all energy fluxes on Earth can eventually be traced to the Sun (except perhaps if the energy is from any ongoing nuclear reactions in the Earth’s core).

There were two major earthquakes yesterday – USGS

  1. 6.6, 23km ESE of Aitape, Papua New Guinea, 2013-04-16 22:55:27 UTC, 13.0 km deep
  2. 7.8, 83km E of Khash, Iran, 2013-04-16 10:44:20 UTC, 82.0 km deep

And – I note in passing – on April 11th – 5 days ago there was a solar flare and a Coronal Mass Ejection (CME) event. Could be just a coincidence of course – but perhaps not …

Discovery News: APR 11, 2013 03:00 PM ET

The sun has unleashed the biggest solar flare of the year, quickly followed by an Earth-directed coronal mass ejection (CME). Both phenomena have the potential to impact communications and electronics on Earth and in orbit.

Although the sun is currently experiencing “solar maximum” — the culmination of its approximate 11-year cycle — scientists have noted that this particular maximum is a lot quieter than predicted. At this time, the sun should be bubbling with violent active regions, exhibiting sunspots, popping off flares and ejecting CMEs. But so far, the sun seems to be taking it relatively easy.

This morning (at 0716 UT), active region (AR) 1719 erupted with an M-class flare. With a rating of M6.5, this event is the most energetic flare of 2013 (although it’s a lot less impressive than 2012′s X-class fireworks). What’s more, the site of the explosion unleashed a CME in our direction.

A CME is a magnetic ‘bubble’ containing high-energy solar particles. When the CME hits Earth’s global magnetic field, it may align just right to generate a geomagnetic storm. Should this happen, we’ll be able to measure the extreme magnetic distortion of the magnetosphere and bright aurorae at high latitudes may result. Aurorae are caused when solar particles are injected into the polar regions via the Earth’s magnetic field — the particles then collide with atmospheric gases, generating a beautiful light display.

This morning’s CME was clocked traveling at a breakneck speed of 600 miles per second — at that rate it should hit Earth in the early hours of Saturday morning (April 13).

Shortly after the M-class flare erupted, a weak solar energetic particle (SEP) event was detected. This “radiation storm” was the result of relativistic particles slamming into the Earth’s upper atmosphere originating from the flare site.

Image: NASA’s Solar Dynamics Observatory captured this image of an M6.5 class flare at 3:16 EDT on April 11, 2013. This image shows a combination of light in wavelengths of 131 and 171 Angstroms. Credit: NASA/SDO

Coral reef not so sensitive to global warming after all (if it ever was)

April 5, 2013

Another “climate sensitivity” to join the long list of global warming exaggerations. A coral reef has recovered from a severe “bleaching” event in just 12 years to a level that was thought to require many decades. In fact the assumption that the cause of the severe disturbance in in 1998 was due to global warming is itself looking very shaky. After all, if it was due to global warming (rather than some local temperature or other event) then why on earth did it reverse in 1998? Or is it just a coincidence that no global warming has been observed since that time?

Polar bear numbers are increasing, clouds may “cool” more than they “heat”, the earth’s green cover is increasing, the Antarctic has more ice than it ever had and the Arctic ice variability is not unprecedented and glaciers are not melting at any greater rate than the pre-industrial rate. It is becoming increasingly clear that the “sensitivity” of the global climate to carbon dioxide has been grossly exaggerated.

Location of Reef building corals

Location of Reef building corals (Photo credit: Wikipedia)

“Recovery of an isolated coral reef system following severe disturbance”, by J. P. Gilmour, L. D. Smith, A. J. Heyward, A. H. Baird and M. S. Pratchett  published online at Science on Friday, 5th April, 2013.

Abstract: Coral reef recovery from major disturbance is hypothesized to depend on the arrival of propagules from nearby undisturbed reefs. Therefore, reefs isolated by distance or current patterns are thought to be highly vulnerable to catastrophic disturbance. We found that on an isolated reef system in north Western Australia, coral cover increased from 9% to 44% within 12 years of a coral bleaching event, despite a 94% reduction in larval supply for 6 years after the bleaching. The initial increase in coral cover was the result of high rates of growth and survival of remnant colonies, followed by a rapid increase in juvenile recruitment as colonies matured. We show that isolated reefs can recover from major disturbance, and that the benefits of their isolation from chronic anthropogenic pressures can outweigh the costs of limited connectivity.

PhysOrg writes: Scott Reef, a remote coral system in the Indian Ocean, has largely recovered from a catastrophic mass bleaching event in 1998, according to the study published in Science today. The study challenges conventional wisdom that suggested isolated reefs were more vulnerable to disturbance, because they were thought to depend on recolonisation from other reefs. Instead, the scientists found that the isolation of reefs allowed surviving corals to rapidly grow and propagate in the absence of human interference. Australia’s largest oceanic reef system, Scott Reef, is relatively isolated, sitting out in the Indian Ocean some 250 km from the remote coastline of north Western Australia (WA). Prospects for the reef looked gloomy when in 1998 it suffered catastrophic mass bleaching, losing around 80% of its coral cover. The study shows that it took just 12 years to recover. Spanning 15 years, data collected and analysed by the researchers shows how after the 1998 mass bleaching the few remaining corals provided low numbers of recruits (new corals) for Scott Reef. On that basis recovery was projected to take decades, yet within 12 years the cover and diversity of corals had recovered to levels similar to those seen pre-bleaching.

Swarm of 482 earthquakes (so far) in Iceland

April 2, 2013

Something to watch closely over the next few days. Could a new island be forming?

UPDATE2: 04 Apr 18:57 GMT

The aviation colour code for Hekla volcano has been changed from yellow to green as no further signs of unrest have been detected since it was changed to yellow. The activity in North Iceland has been decreasing today. The activity could still continue for a some time with intense activity in between.

UPDATE: A M5.5 earthquake occurred at 00:59 on 2nd April 2013 about 15 km east of Grímsey island offshore North Iceland. The earthquake was felt at Grímsey, Húsavík, Raufarhöfn, Mývatnssveit, Akureyri and Sauðarkrókur. Several hundruds aftershocks have been detected following the mainshock. The source region is located on a fault system that reaching from Öxarfjörður to the north of Grímsey, the so called Grímsey lineament. Another M4.7 earthquake followed this morning at 08:56 and was located about 7.5km northwest of the night’s main event.

Earthquake sequences are common in this area. It is impossible to predict the further development of the seismic activity and how it might influence faults in its vicinity. Further large events can not be excluded.

==========================================

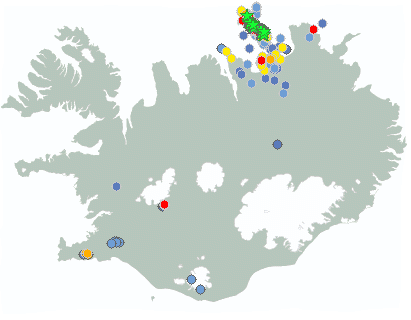
The Iceland earthquake swarm has now reached a count of 482 according to the Icelandic Met Office.

  • Magnitude less than 1 in all:  39
  • Magnitude 1 to 2 in all:  173
  • Magnitude 2 to 3 in all:  232
  • Magnitude more than 3 in all:  38
  • Total: 482 (upto 712 on 3rd April)
Earthquakes during last 48 hours.  at 04 Apr 19:50 GMT

Earthquakes during last 48 hours. at 04 Apr 19:50 GMT

From Earthquake Report:

Update 10:49 UTC : We have added a Google Earth screenshot to the image series. This Google earth image shows very clearly the many volcanic bubbles at the ocean floor, a result of the separating diverging plates. The 2 tectonic plates are pullling away from each other  (left plate to the West, right plate to the East. This kind of phenomenon is also occurring in the Oceans all over the world. New life (in other words new magma) is added this way to the tectonic plates. The plates are melting away again below ie. the deep trenches of the Pacific Ocean.

Update 10:12 UTC : The Icelandic seismological Bureau wrote : At 00:59 an earthquake about 5.5 occurred, 15 km east of Grímsey. the earthquake was felt in substantial part of central north Iceland. Following the this event at 1:13 another earthquake 4,3 was observed 16 km east of Grímsey and at 08:55 an earthquake 4,7 at same location. Substantial aftershock activity has been observed and still continues. More activity can be expected.

This earthquake is part of a strong swarm at a well know location in the Ocean. The location of the swarm is a relatively shallow ridge area (the zigzagging ridge creates the transform-like earthquakes) . A ridge is a location where 2 tectonic plates are pulling away from each other. Fresh magma will have an easier job to reach the seabed and hot volcanic vents are often found on these locations. A new island in such an area is almost a certainty in the geological future. A pity that there are no permanent ROV’s in this location, we might see some submarine fireworks!
At the time of writing this article, we have counted 314 earthquakes in less than 48 hours!

Screen Shot 2013-04-02 at 12.48.02

Swarm area on Google Earth

Icleand lifts Hekla alert to yellow

March 26, 2013

For the first time in two years the Iceland Meteorological Office has raised the aviation warning code for Mount Hekla from green to yellow due to unusual seismic activity around the volcano. Seven minor seismic events have occurred since 10th March and these are considered abnormal around Hekla. Hekla has erupted 20 times since 874 CE and erupted last in 2000 and previously – in recent times – in 1991, 1981,1980, 1970 and 1947.

The Icelandic Meteorological Officehas changed the aviation colour-code of Hekla volcano from green to yellow, signifying elevated unrest above a known background level during the last weeks. The Icelandic Civil Defence together with the Police in Hvolsvöllur have declared a level of uncertainty for Hekla. The change from green to yellow is a precautionary step due to increased earthquake activity. To date, there are no observable signs that an eruption of Hekla is imminent.

location of iceland volcanos (from decadevolcano.net)

Calculating Doomsday – An interesting but ultimately meaningless probability game

March 21, 2013

A new paper playing probabilistic games – this time about the Doomsday Argument.

Universal Doomsday: Analyzing Our Prospects for Survival, by Austin Gerig, Ken D. Olum, Alexander Vilenkin,  arxiv.org/abs/1303.4676 , Cosmology and Extragalactic Astrophysics (astro-ph.CO)

The full version of the paper (pdf) is here

Doomsday argument Gerig et al

Doomsday argument Gerig et al

The Doomsday Argument is the idea that we can estimate the total number of humans that will ever exist, given the number that have lived so far. The argument goes that since around 100 billion is the number of humans that have ever lived and assuming that there is a 95% probability that we are among the last 95% of humans who will ever live then there is a 95% probability that the number of humans who will ever live will lie between 1.4 and 2.0 trillion. A fairly trivial conclusion since any probability greater than 0 and less than 100% would be valid for the exercise.

In this paper the authors try to formalise the probability calculations and introduce the effect of known existential threats. Just like in Drake’s equation for the number of extra-terrestrial civilisations that may exist in the Milky Way, all the probabilities are unknown and could be assumed to be anything you like. The Doomsday Argument like Drake’s equation is really no more than a probability game, based on nothing at all. But it is fascinating to consider which terms are relevant and necessary in any such game.  And that is what makes these games interesting.

The author’s conclusions could be considered a trifle obvious and almost cliched – but none the less they are perfectly true!! The Earth will surely experience catastrophic events in the future which threaten human existence – whether by earthquake or volcanos or meteors and even if we survive all of these, eventually by the inevitable death of our sun.  In fact you could play another – and equally valid – probability game and calculate how many humans will have lived if humanity continues to survive till the death of our sun. And this probability is surely not zero.

To avoid Doomsday, humanity needs to make sure that asteroids don’t crash into earth and that catastrophic earthquakes, volcano eruptions or the like don’t occur until  such time as humanity has spread into space and  developed colonies on other planets.

From the Conclusions:

With the priors that we considered, the fraction of civilizations that last long enough to become large is not likely to exceed a few percent. If there is a message here for our own civilization, it is that it would be wise to devote considerable resources (i) for developing methods of diverting known existential threats and (ii) for space exploration and colonization. Civilizations that adopt this policy are more likely to be among the lucky few that beat the odds. Somewhat encouragingly, our results indicate that the odds are not as overwhelmingly low as suggested by earlier work. 

Abstract (Submitted on 19 Mar 2013)

Given a sufficiently large universe, numerous civilizations almost surely exist. Some of these civilizations will be short-lived and die out relatively early in their development, i.e., before having the chance to spread to other planets. Others will be long-lived, potentially colonizing their galaxy and becoming enormous in size. What fraction of civilizations in the universe are long-lived? The “universal doomsday” argument states that long-lived civilizations must be rare because if they were not, we should find ourselves living in one. Furthermore, because long-lived civilizations are rare, our civilization’s prospects for long-term survival are poor. Here, we develop the formalism required for universal doomsday calculations and show that while the argument has some force, our future is not as gloomy as the traditional doomsday argument would suggest, at least when the number of early existential threats is small.

Breaking weather records from a century ago only shows that it was hotter before CO2 emissions began

July 14, 2012

I am off again on an assignment for a few days and blogging will be light.

It’s summer and where I’m going torrential rain or blistering sunshine with temperatures over 45 °C  are quite normal for this time of year. If it is raining the temperature may be down to 25°C. So I’m prepared for a possible variation of some 20 deg C. It’s just weather.

I note the usual summer stories from around the world of heat waves in some places and “coldest” Junes in a 100 years in others. Some farmers are complaining about droughts and others are complaining about floods. Where societies have ignored repairs or have not built up their infrastructure to match the changing concentrations of urban populations – disasters occur. But I also note that when parts of the US declares that they have just had the hottest period for 50 years or 100 years or whatever and that this is “proof” of global warming they conveniently forget that 50 years ago or 100 years ago or whenever, man-made emissions of carbon dioxide were orders of magnitude lower. When weather records from a hundred years ago are broken it only proves that it was hotter/colder/stormier/wetter/drier or whatever long before the modern industrial age and before any significant man man-made carbon dioxide emissions.  Breaking an old record only shows cyclic behaviour – not “runaway” behaviour!

It’s summer and people are on vacation and journalists are looking for stories and the silly season has begun!