Archive for the ‘Solar science’ Category

A quiet sun flexes its muscles

February 17, 2011

Update: February 18th 0700 CET

http://www.spaceweather.com/

A CME hit Earth’s magnetic field at approximately 0100 UT on Feb. 18th (8:00 pm EST on Feb. 17th). The impact was not as strong as expected considering the cloud’s X-class origin.

Solar Cycle 24 is generally exhibiting a very low level of activity but the sun occasionally does flex its muscles just to show what it is capable of.

http://solarcycle24.com/

Geomagnetic Storm Watch – From the Space Weather Prediction Center: February 16, 2011 — The calm before the storm. Three CMEs are enroute, all a part of the Radio Blackout events on February 13, 14, and 15 (UTC). The last of the three seems to be the fastest and may catch both of the forerunners about mid to late day tomorrow, February 17.

http://www.swpc.noaa.gov/

February 17, 2011 — The first interplanetary shock, driven by the CME from Sunday, is expected any time. Soon thereafter, the shock from Monday evening’s R3/CME is due. Look for G1-G2 (and maybe periods of G3 if the following shock compresses and enhances the CME magnetic field). Geomagnetic storming should persist 24- 48 hours. Back at the Sun, Region 1158 is still hot and fast-growing, Region 1161 is producing small flares.

image NOAA

3-day Solar-Geophysical Forecast issued Feb 16 22:00 UTC

Solar Activity Forecast: Solar activity is expected to be moderate with a chance for an isolated major flare for the next three days (17-19 February). Region 1158 is expected to produce more M-class flares and still has the potential for producing an M5 or greater x-ray event. There is a chance for isolated M-class activity from Region 1161.

Geophysical Activity Forecast: The geomagnetic field is expected to be predominately quiet on day one (February 17). An increase to unsettled to active conditions, with a chance for minor storm periods is expected late on day one into day two (18 February). The increased activity is forecast due to the expected arrival of the CME associated with the X2 flare that occurred on 15/0156Z. Day three (19 February) is expected to be quiet to active as the disturbance subsides.


An active Sunday for the Sun

February 14, 2011

An unusually active Sunday for the Sun yesterday mainly from the very large sunspot 1158 with magnetic flux values not seen since 2006.

From Solarcycle24.com:

Solar Flares: Mutiple Solar flares took place around Sprawling Sunspot 1158 on Sunday, including an M6.6 Flare which was the 2nd largest of Cycle 24 thus far.  ….. . There will continue to be a chance for M-Class flares and NOAA also lists a 5% chance for an X-Class event.

Solar Flux 107: For the first time in Cycle 24, the official daily solar flux number measured in Penticton, BC closed above 100. The solar flux of 107 is the highest since September 2005. The last time the solar flux finished above 100 was in December 2006.

Solar Update: Huge sunspot 1158 which is located in the southern hemisphere will continue to be a threat for strong solar flares. Elsewhere, Sunspot 1157 which is in the northern hemisphere showed growth late on Sunday and Sunspot 1160 which rotated into view on the eastern limb has sprouted a few new spots as well. The M6.6 Solar Flare did cause a Radio Blackout on HF which was short lived.

Sunspots (Early Monday): image solarcycle24.com

NOAA forecast:

Solar Activity Forecast: Solar activity is expected to be low to moderate with a chance for a major x-ray event for days one thru three (14-16 February). Region 1158 continued growth and recent major flare make this region the most likely source for a major event. There is a slight chance for C-class activity from Region 1157 and Region 1159.

Geophysical Activity Forecast: The geomagnetic field is expected to be predominately quiet on day one (14 February). Quiet to unsettled with a chance for active conditions are expected on days two and three (15-16 February), due to a recurrent coronal hole high speed stream becoming geoeffective.

Solar Cycle 24 forecast reduced yet again

February 10, 2011

We had a reduced forecast from NASA just a month ago and it has reduced yet again.

The peak is now expected in July 2013 but this could well slip a month or two. This Landscheidt Minimum continues to look like a Dalton Minimum.

December 2010 forecast smoothed sunspot number maximum of 64 in June 2013

January 2011 forecast smoothed sunspot number maximum of 59 in June/July 2013

February 2011

Current prediction for the next sunspot cycle maximum gives a smoothed sunspot number maximum of about 58 in July of 2013. We are currently two years into Cycle 24 and the predicted size continues to fall.

The latest forecasts for sunspot number and 10.7 Radio flux and Ap progression are here: http://www.swpc.noaa.gov/SolarCycle/

Related:

https://ktwop.wordpress.com/2010/12/23/is-the-landscheidt-minimum-a-precursor-for-a-grand-minimum/

Do super storms indicate that earth’s magnetic polarity is about to switch?

February 8, 2011


geomagnetic reversal is a change in the orientation of Earth’s magnetic field such that the positions of magnetic north and magnetic south become interchanged. These events often involve an extended decline in field strength followed by a rapid recovery after the new orientation has been established. These events occur on a scale of tens of thousands of years or longer, with the latest one (the Brunhes–Matuyama reversal) occurring 780,000 years ago.

On average geomagnetic reversals occur about every 500,000 years so it would seem that a reversal is overdue. How long a reversal takes and whether a reversal can happen very rapidly is not known. That the earth’s geomagnetic field is due to the flow of liquid metals in the earth’s interior – the dynamo theory – is also very likely. The sun’s magnetic reversals seem to happen at every sunspot maximum with an average period of 11 years between reversals giving a 22 year magnetic cycle.

The movement of Earth's north magnetic pole across the Canadian arctic, 1831-2001. Credit: Geological Survey of Canada.

The movement of Earth's north magnetic pole across the Canadian arctic, 1831--2001. Credit: Geological Survey of Canada.

The position of the magnetic poles is also continuously changing with a current drift (increasing) of the magnetic North Pole from N. Canada towards Siberia at about 40km /year. But this movement may be in some cyclic fashion and is unlikely to be directly connected to the half-million year reversals. For the last 200 years the strength of the earth’s magnetic field has been decreasing and could be the precursor of the overdue reversal.

How the earth will behave during a magnetic reversal is a known unknown and provides the basis of much speculation and cataclysmic theories which cannot be tested. The cataclysmic pole shift hypothesis is one such theory which predicts that the earth’s rotation will reverse, the magnetic field will reverse and mankind will be obliterated – probably in 2012!!

But it is thought that reversals take a few thousand years to complete, and during that time–contrary to popular belief–the magnetic field does not vanish.  Magnetic lines of force near Earth’s surface become twisted and tangled, and magnetic poles pop up in unaccustomed places. A south magnetic pole might emerge over Africa, for instance, or a north pole over Tahiti. Weird. But it’s still a planetary magnetic field, and it still protects us from space radiation and solar storms.

Terrence Aym suggests that we may be seeing the beginning of a reversal (and of course since this is overdue it may well occur at any time):

Forget about global warming—man-made or natural—what drives planetary weather patterns is the climate and what drives the climate is the sun’s magnetosphere and its electromagnetic interaction with a planet’s own magnetic field.

File:Magnetosphere rendition.jpg

Artist's rendition of Earth's magnetosphere: NASA via Wikipedia

Magnetic polar shifts have occurred many times in Earth’s history. It’s happening again now to every planet in the solar system including Earth. The magnetic field drives weather to a significant degree and when that field starts migrating super storms start erupting.

The superstorms have arrived.

The Earth’s northern magnetic pole was moving towards Russia at a rate of about five miles annually. That progression to the East had been happening for decades.

Suddenly, in the past decade the rate sped up. Now the magnetic pole is shifting East at a rate of 40 miles annually, an increase of 800 percent. And it continues to accelerate.

Recently, as the magnetic field fluctuates, NASA has discovered “cracks” in it. This is worrisome as it significantly affects the ionosphere, troposphere wind patterns, and atmospheric moisture. All three things have an effect on the weather.

Worse, what shields the planet from cancer-causing radiation is the magnetic field. It acts as a shield deflecting harmful ultra-violet, X-rays and other life-threatening radiation from bathing the surface of the Earth. With the field weakening and cracks emerging, the death rate from cancer could skyrocket and mutations of DNA can become rampant.

Another federal agency, NOAA, issued a report caused a flurry of panic when they predicted that mammoth superstorms in the future could wipe out most of California. The NOAA scientists said it’s a plausible scenario and would be driven by an “atmospheric river” moving water at the same rate as 50 Mississippi rivers flowing into the Gulf of Mexico……

According to some geologists and scientists, we have left the last interglacial period behind us. Those periods are lengths of time—about 11,500 years—between major Ice Ages. One of the most stunning signs of the approaching Ice Age is what’s happened to the world’s precessional wobble. The Earth’s wobble has stopped. ..

….So, the start of a new Ice Age is marked by a magnetic pole reversal, increased volcanic activity, larger and more frequent earthquakes, tsunamis, colder winters, superstorms and the halting of the Chandler wobble.

Unfortunately, all of those conditions are being met.

Read original article


Global cooling indicators are increasing

January 23, 2011

The conditions in the relatively thin, chaotic surface layer of atmosphere surrounding the earth within the earth-sun system are what we call climate in the long term over large geographic regions and what we call weather in the short term over small geographic regions. I am convinced that these conditions are dominated by the sun and that the primary vehicles for transporting energy around the earth’s surface (and which is decisive for the chaotic boundary layer) are the oceans. The energy carrying capacity of the atmosphere is small compared to that of the oceans.

The major ocean cycles which seem to be most relevant are the Atlantic Multidecadal Oscillation (AMO) and the Pacific Decadal Oscillation (PDO). The El Niño-Southern Oscillation (ENSO) seems to be superimposed on the major cycles which which may even derive from ENSO and the deep ocean circulation patterns. The major cycles also contain sub-cycles such as the Nothern Atlantic Oscillation (NAO) or the Southern Oscillation Index (SOI). There are other minor cycles such as the Arctic Oscillation Index (AO) and the Antarctic Oscillation (AAO).

The indicators that we are in a period of 20 – 30 years of global cooling are increasing:

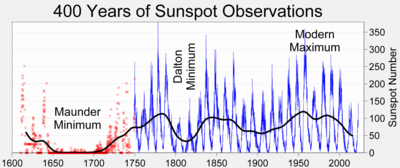
1. The quiet sun is perhaps the most important indicator we have that we are entering (or have entered) a global cooling period. The period 2000 – 2030 could well be similar to that during the Dalton Minimum between 1790 – 1820.

Image Attachment

graphics credit: sc25.com

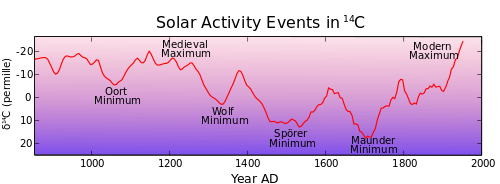
2. There have been regular periods of warming and cooling in the past.

Alternating periods of warm and cooler weather have been with us as far back as our climate records go. Some of the past cooler periods have been more severe than others, like the Sporer, Maunder and Dalton Minimums. Professor Don Easterbrook has documented some 20 such cool periods over the last 500 years

Figure 1

graphic: Don Easterbrook

3. Taking just the main ocean cycles, the AMO is a 66 year cycle.

AMO peaks occurred on May 1878 and November 1944. The next peak is forecasted to occur in April 2011. The last trough occurred in January 1978, and the next trough is expected to occur in June 2044. As we see here, the length of a complete cycle is about 66.5 years.

The AMO went positive in 1994 and actually peaked in July 2010 and is now on its way down. It should go negative sometime in 2015 and remain negative till about 2048.

4. The Pacific Decadal Oscillation (PDO) has a shorter cycle of about 60 years.

graphic: digitaldiatribes.files.wordpress.com

The PDO cycle is not quite as long as AMO. Because the periods differ, their peaks and troughs will vary relative to each other. This has an interesting long-term result in terms of warming and cooling. The PDO had a peak in the function in October 1929 (about 15 years prior to AMO). The next peak occurred May 1990 (about 21 years prior to the anticipated AMO peak). The period here is about 60.5 years.

PDO has gone negative since September 2007  and will remain in negative territory probably for the next 30 years. For about 2 decades the PDO and the AMO will both be negative (but as can be seen above the amplitude of the short term variations are so large that short periods in the positive region are perfectly possible and inevitable, even while the long term average is negative or vice versa.)

5. ENSO and the efects of La Niñas and El Niños.

Returning to Matti Vooro’s article:

During negative or cool phases of PDO and AMO, there are more La Niñas than during the positive phases. This contributes to more cold winters and colder years during negative PDO. During positive or warm phases of PDO and AMO, there are significantly more El Niños. This is why there is more warming when the PDO is positive. The current negative or cool PDO and the La Niña are why we have had all the recent cold weather. The La Niña’s may have directly contributed to the Red River Flooding of 2009 and the recent flooding in Australia and Brazil.

…. The AMO is affected by ENSO cycles, especially El Ninos, so we saw a brief warming of AMO during 2010. Climate history shows that global cooling was strongest when both the PDO andAMO were both simultaneously in the negative or cool mode – like in 1964-1976 and again 1916 to 1923. The AMO cycles have been quite variable. During its last cycle it was in the negative or cool mode for 30 years (1964-1994] and its cycle seems to be related to the Meridional Overturning Circulation [MOC] and the changes in the Atlantic Thermohaline Circulation [THC]. There are a number of estimates when it will again go negative. My best estimate is about 2015 based on the most frequent past intervals of around 20 years and the cooler waters that feed the MOC from the Southern Oceans. Once it does go negative, the global temperature anomalies may drop further until about 2030, the Arctic temperature may cool further and the Arctic ice extent should increase again.

Professor Easterbrook has made a global forecast for temperature:

The IPCC projections are no longer credible but it must be borne in mind that these projections had little to do with actually bringing science to make the best forecast possible but instead were focused on poltical objectives; it seems mainly to redistribute wealth and to demonise CO2 so as to drive the carbon trading market.

That global cooling is upon us seems more and more likely and I apprehend that Easterbrooks’s lowest curve will materialise and show that the current Landscheidt minimum will be comparable to the Dalton minimum.


Indian Environment Ministry challenges IPCC and CO2 conclusions

January 21, 2011
Cropped from image of Jairam Ramesh the Indian...

Jairam Ramesh: Image via Wikipedia

That there is little love lost between Rajendra Pachauri and the Indian Minister of Environment Jairam Ramesh is no secret. (Pachauri made the ill-advised and stupid remark about “voodoo science” regarding Ramesh and the Ministry’s claims debunking the IPCC ststements on Himalyan glaciers). Now according to the Hindustan Times the Ministry of Envirionment has produced a paper concluding that solar effects on clouds represent about half the warming effects attributed to CO2:

India has once again challenged the UN’s climate science body – the Intergovernmental Panel on Climate Change (IPCC) — through a new scientific paper. The Environment ministry sponsored paper says that human induced global warming is much less than what the R K Pachauri headed IPCC had said. The cause is reduced impact of Galactic Cosmic Rays (GCRs) on formulation of low clouds over earth in the last 150 years, says a paper by U R Rao, former chairman of Indian Space Research Organisation, released by Environment minister Jairam Ramesh. ….

Analyzing the data between 1960 and 2005, Rao found that lesser GCRs were reaching the earth due to increase in solar magnetic field and thereby leading to increase in global warming. “Consequently the contribution of increased CO2 emission to be observed global warming of 0.75 degree Celsius would only be 0.42 degree Celsius, considerably less than what predicted by IPCC,” the paper said to be published in Indian Journal Current Science had said. This is about 44 % less than what IPCC had said.

Ramesh in 2009 had released a similar scientific paper saying that the IPCC’s claim that most Himalayan glaciers will melt by 2035 was wrong. A few months later, after a review the IPCC regretted the error. If Ramesh latest bid gets globally recognition, it can alter the rules of UN run climate negotiations of 200 nations.

Impact of GCRs on global warming had been highly controversial since 1998, when Henrik Svensmark of Danish National Space Center said it was causing global warming. A decade later a joint European study debunked the claim, saying there was no co-relation. …

“I just want to expand scientific debate on impact of non-Green House Gases on climate change,” Ramesh said, when asked whether he was again challenging the IPCC. “Science is all about raising questions.”

International climate science is mainly western driven and collaborates the view of the rich world that gases such as Carbon Dioxide (CO2) are the main contributor for global warming. Any scientific work challenging the view has been debunked as work of a sceptic.

“Climate science is much more complex than attributing everything to CO2,” said Subodh Verma, climate change advisor in the Environment ministry.

And, its first impact has come from IPCC chairperson R K Pachauri, who has told the government, that impact of GCRs on global warming will be studied in depth in the fifth assessment report to be published in 2013-14. In its earlier four assessment reports, IPCC had not studied the impact of GCRs in detail.

The Global Warming establishment does not much like this paper. But they have now been reduced to claiming that everything – even directly conflicting evidence – supports the theory of man-made CO2 on global warming:

V Ramanathan of US based Scripps Institute of Oceanography at University of California said the Rao’s paper strengthens the case for greenhouse a primary driver for global warming. “The observed rapid warming trends during the last 40 years cannot be accounted for (by) the trends in GCRs,” he said, in his comments on Rao’s paper.

Science is indeed all about asking questions.

It seems to have been forgotten that anyone who  is not a sceptic deep down  is not – and can not be – a scientist.

NASA reduces forecast for Solar Cycle 24 again

January 19, 2011

In December NASA had reduced its forecasts for SC24 to a peak sunspot number of 64 being reached in June 2013. Now less than two months later, the latest forecast has been reduced again to a peak sunspot number of 59 to be reached in June / July 2013.

We find a starting time of May 2008 with minimum occurring in December 2008 and maximum of about 59 in June/July of 2013.

NASA SC24 forecast - January 2011: image NASA

At these levels the current Landscheidt minimum is comparable to SC5 and SC6 – the Dalton Minimum of 1790 to 1830 – where peak sunspot numbers were just over 50. (The earlier Maunder Minimum – 1645 to 1715- was before the modern period of sunspot number measurement and nominally was a period with no significant sunspots – presumably at sunspot numbers of less than 20 in today’s measurement values).

From my previous post:

It is not inconceivable that the SC24 will not peak till early 2014 and will only achieve peak sunspot numbers around 55. Solar cycle 24 could well have a length of 150+ months instead of the nominal 132 months.

The development of the NASA predictions are in the table below:

NASA Forecasts for SC24

Date of

forecast

Expected date

of peak

Expected peak

sunspot number

March 2006 June 2010 168
October 2008 March 2012 137
January 2009 June 2012 104
January 2010 June 2013 90
December 2010 June 2013 64
January 2011 June / July 2013 59


Related:

https://ktwop.wordpress.com/2010/12/23/is-the-landscheidt-minimum-a-precursor-for-a-grand-minimum/

Sundog (parhelion) as seen in N. China

January 11, 2011

A parhelion (sundog) combined with a halo is seen in Changchun, capital of northeast China's Jilin Province, Jan. 8, 2011. (Xinhua/Lin Hong)


From Wikipedia:

Sundogs are formed by plate-shaped hexagonal ice crystals in high and cold cirrus clouds or, during very cold weather, by ice crystals called diamond dust drifting in the air at low levels. These crystals act as prisms, bending the light rays passing through them by 22°. If the crystals are randomly oriented, a complete ring around the sun is seen — a halo. But often, as the crystals sink through the air they become vertically aligned, so sunlight is refracted horizontally — in this case, sundogs are seen.

As the sun rises higher, the rays passing through the crystals are increasingly skewed from the horizontal plane. Their angle of deviation increases and the sundogs move further from the sun. However, they always stay at the same altitude as the sun.

Sundogs are red-colored at the side nearest the sun. Farther out the colors grade through oranges to blue. However, the colors overlap considerably and so are muted, never pure or saturated. The colors of the sundog finally merge into the white of the parhelic circle (if the latter is visible).

It is theoretically possible to predict the forms of sundogs as would be seen on other planets and moons. Mars might have sundogs formed by both water-ice and CO2-ice. On the giant gas planets — Jupiter, Saturn, Uranus and Neptune — other crystals form the clouds of ammonia, methane, and other substances that can produce halos with four or more sundogs.

Solar Cycle 24 is unusually quiet but not unprecedented

December 29, 2010

NASA has made a new reduced forecast for the peak sunspot number and the time of occurrence of the peak of Solar Cycle 24. The peak number has been reduced from 90 to 64 and the time of the peak is unchanged at June 2013.

I have superimposed the development of the forecast peak and time of the peak on the base forecast. This is not any criticism of the forecast. It only emphasises that the forecasts are about something which is not very well understood. So far the forecast development is only in the direction of reducing sunspot numbers and delays in the time of attaining the peak. As the peak actually approaches the forecasts should stabilise but there is still some room for further reduction. It is not inconceivable that the SC24 will not peak till early 2014 and will only achieve peak sunspot numbers around 55. Solar cycle 24 could well have a length of 150+ months instead of the nominal 132 months.


SC24 forecast development superimposed on NASA forecast (http://solarscience.msfc.nasa.gov/images/ssn_predict_l.gif)

That SC24 represents a very quiet sun and that taken together with SC23 this Landscheidt minimum represents a behaviour similar to the period leading up to the Dalton minimum is quite clear insofar as sunspot number is concerned. But the length of Solar Cycle 23 and its extended quiet period also has precedence.

Further similarities to SC4 and 5 were reported in

Agee, Ernest M., Emily Cornett, Kandace Gleason, 2010: An Extended Solar Cycle 23 with Deep Minimum Transition to Cycle 24: Assessments and Climatic Ramifications. J. Climate, 23, 6110–6114.
doi: 10.1175/2010JCLI3831.1

The extended length of solar cycle 23 and the associated deep quiet period (QP) between cycles 23 and 24 have been examined using the international sunspot record from 1755 to 2010. This study has also introduced a QP definition based on a (beginning and ending) mean monthly threshold value of less than 10 for the sunspot number. Features addressed are the length and intensity of cycle 23, the length of the QP and the associated number of spotless days, and the respective relationships between cycle intensity, length, and QP. The length of cycle 23 (153 months) is second only to cycle 4 (164 months), with an average of 132.5 months for the 11-yr cycle. The length of the QP between cycles 23 and 24 ranks eighth, extending from October 2005 through November 2009 (but subject to continued weakness in cycle 24). The number of spotless days achieved within this QP was 751 (and for all days within the transition from cycle 23 to cycle24, a record number of 801 spotless days had been observed through May 2010). Shortcomings of solar-convection-model predictions of sunspot activity and intensity are also noted, including the failure in the initial predictions of cycle-24 onset.

It would not be too surprising if SC24 only reached levels which were  lower than the Dalton minimum and perhaps even approaching the lows of the Maunder minimum.


Is the Landscheidt minimum a precursor for a grand minimum?

December 23, 2010

It took 500 years with reducing solar activity to get from the Medieval maximum to the the grand Maunder minimum. The Dalton minimum came a little over a 100 years later as solar activity was increasing to its modern maximum in the years preceding Solar Cycle 22 (c. 1890 – 1990). Now with the Landscheidt minimum seemingly well established, SC 23 and the current SC 24 show a clear trend of declining solar activity. SC’s 22, 23 and 24 are remarkably similar to SC’s 3, 4 and 5. The Dalton minimum coincided with SC’s 5 and 6.

It is reasonable to assume that climatic conditions over the next 20 – 30 years will resemble those prevailing between 1790 and 1820. But SC24 has a way to go yet and it could be that solar activity for SC24 and 25 will be even lower than during the Dalton minimum and perhaps closer to the Spörer minimum but perhaps not as deep as the Maunder minimum.

But in either case the solar activity to come following the Modern maximum may well resemble the 500 years of decline in solar activity which followed the Medieval maximum.

http://en.wikipedia.org/wiki/Dalton_Minimum

Solar activity events recorded in radiocarbon. Present period is on left. Values since 1950 not shown: Wikipedia

http://en.wikipedia.org/wiki/Maunder_Minimum

The Maunder minimum in a 400 year history of sunspot numbers: Wikipedia

http://sc25.com/index.php?id=268&linkbox=true&position=10

Image Attachment

The excellent historical weather chronology covering 1800 years put together by James A Marusek shows that the period between 1790 and 1820 was characterised not only by colder weather but also by violent fluctuations of seasonal weather. An extract of the chronology during the Dalton minimum is here: (weather chronology Dalton).

I give little credence to AGW Alarmism and the doom-saying regarding the effects of carbon dioxide. Environmentalism which was (and still is) highly admirable when concerned with the improvement of local conditions went off the rails when it went “global” and came to be dominated by the overweening arrogance of ignoring the sun and the presumption of super-computers and inadequate computer models.  Rather I am persuaded about the dominance of solar influences on the chaotic system which is our climate.

Whether or not a grand solar minimum is on its way, we are in for a decade of two of reduced activity and a cooling trend during this Landscheidt minimum.